Unlocking Efficiency with Six Sigma Process Mapping

Six Sigma Process Mapping gives teams a clear picture of how work flows in areas like Hiring Systems and Business Management. Defining the context and scope at the start creates focus and keeps the map useful. Experts note several benefits of this approach:
Defining the scope and objectives is essential for creating an effective process map.
It ensures clarity about what the process map will cover and its intended outcomes.
A well-defined scope prevents unnecessary complexity and maintains focus on critical areas.
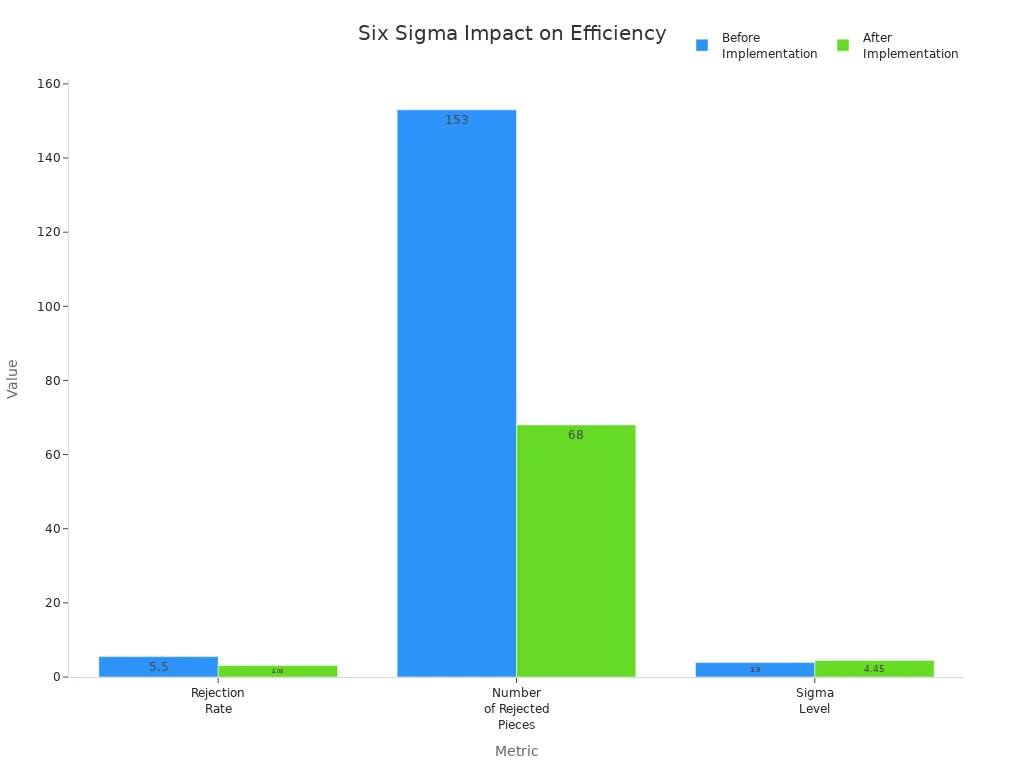
Teams use this mapping to spot waste and guide improvement. Shared Knowledge grows as everyone sees the process steps. The impact shows in real results:
Metric | Before Implementation | After Implementation | Improvement |
|---|---|---|---|
Rejection Rate | 5.5% | 3.08% | Reduced by 2.42% |
Number of Rejected Pieces | 153 | 68 | Reduced by 85 pieces |
Cost Savings per Month | N/A | Rs. 15,249 | N/A |
Sigma Level | 3.9 | 4.45 | Improved by 0.55 |
Key Takeaways
Six Sigma Process Mapping helps teams visualize workflows, making it easier to understand each step and improve communication.
Defining the scope and objectives at the start keeps the process map focused and prevents unnecessary complexity.
Using process maps allows teams to identify waste and inefficiencies, leading to better quality and customer satisfaction.
Regularly updating process maps ensures they reflect real operations and support continuous improvement efforts.
Cross-functional teams bring diverse perspectives, leading to more effective process maps and stronger results.
Process mapping aids in training new employees by providing clear, standardized workflows that reduce confusion.
Visual tools like SIPOC diagrams and swimlane charts help teams see roles and responsibilities, improving collaboration.
Linking process mapping to continuous improvement creates a culture of learning, helping organizations adapt and thrive.
Six Sigma Process Mapping Overview
What Is Process Mapping
Process mapping gives teams a visual tool to understand how work flows from start to finish. It shows each step, the actions taken, and the results produced. Teams use process maps to see how inputs move through a process and become outputs. This visual approach helps everyone understand the sequence of events and the relationships between different parts of a process.
Process mapping displays steps, events, and operations in a process.
It provides a pictorial illustration of inputs and outputs.
It shows how different actions connect and where decisions happen.
Common tools include Process Flowcharts, Deployment Flowcharts, and Alternate Path Flowcharts.
By using these tools, teams can quickly spot where problems or delays might occur. They can also see how work moves between people or departments.
Why It Matters in Six Sigma
Six Sigma Process Mapping plays a key role in improving quality and efficiency. It helps teams define the boundaries of a process and set clear goals. When teams map a process, they can find waste, errors, or steps that do not add value. This leads to better results and higher customer satisfaction.
Core Component | Description |
|---|---|
Establishing clear boundaries for the process and identifying goals to ensure focused efforts. |
Objective | Description |
|---|---|
Clarity in Business Processes | Making processes clear to help teams identify problems, improve quality, and reduce waste. |
Process mapping also supports training and standardization. New team members can learn faster when they see a clear map of the process. Standardized maps help everyone follow the same steps, which reduces mistakes.
Importance | Description |
|---|---|
Support for Training and Standardization | Process maps aid in training new team members and standardizing workflows. |
Many organizations have seen strong results from using process mapping. For example, Tui Ora in New Zealand improved productivity by 75% and reduced quality defects by 70%. University Hospitals Birmingham NHS in the UK cut effort by 50% and doubled turnaround speed. These outcomes show how mapping can drive real improvements.
Key Principles
Six Sigma Process Mapping follows several key principles. These principles guide teams as they create and use process maps.
Principle | Description |
|---|---|
Customer Focus | Understanding and meeting customer needs and expectations is essential for organizational success. |
Leadership | Leaders must create a unified purpose and environment that encourages involvement in achieving quality objectives. |
Engagement of People | Empowered and engaged individuals at all levels enhance organizational capabilities and contribute to quality improvement. |
Process Approach | Managing activities and resources as interlinked processes leads to more efficient achievement of desired results. |
Improvement | Continuous improvement of products, services, and processes is a fundamental goal for successful organizations. |
Evidence-Based Decision Making | Decisions should be based on data analysis to ensure objectivity and confidence in outcomes. |
Relationship Management | Building mutually beneficial relationships with external providers enhances value creation. |
Teams that follow these principles can create process maps that lead to lasting improvements. They focus on the customer, involve everyone, and use data to make decisions. This approach helps organizations reach their goals and deliver better results.
Process Mapping Steps
Define Phase
Set Context and Scope
Teams begin the Define phase by establishing clear boundaries for the process. They identify where the process starts and ends, which roles participate, and what inputs and outputs matter most. Setting context prevents confusion and keeps the project focused. Teams outline specific inclusions and exclusions to avoid scope creep. They regularly review the project charter to stay aligned with goals. A formal change control process helps manage any proposed changes. Stakeholders learn the importance of sticking to the agreed scope, and teams document out-of-scope requests for future consideration. Communication remains key throughout the project, reinforcing the scope and direction.
Tip: Use the DMAIC framework to maintain structure and direction during the Define phase.
Identify Objectives
Teams clarify objectives by creating a clear problem statement. They identify what needs improvement and set measurable goals. Objectives guide the mapping process and ensure everyone understands the desired outcomes. Teams communicate these objectives to all stakeholders, which builds alignment and commitment. A well-defined objective helps teams focus on critical areas and avoid unnecessary complexity.
Measure Phase
Gather Data
During the Measure phase, teams collect data to establish a baseline for current process performance. They capture exact cost figures to quantify financial value added to the company. Identifying key performance indicators (KPIs) allows teams to evaluate performance and track improvements. Financial data helps analyze savings achieved at the end of the project. Teams select KPIs that reflect important aspects of the process, such as cycle time, defect rates, and customer satisfaction scores.
Establish baseline performance
Capture financial data for value analysis
Identify KPIs for tracking improvements
Map Current State
Teams use several methods to map the current state of a process. SIPOC diagrams provide a high-level overview, showing suppliers, inputs, process steps, outputs, and customers. Flowcharts illustrate steps in a sequential manner, helping teams document and analyze the process. Swimlane charts categorize steps by roles or departments, highlighting responsibilities and potential bottlenecks. Mapping the current state graphically makes it easier to understand and optimize. Teams define the process clearly before making improvements.
Process Map Type | Description |
|---|---|
SIPOC Diagram | Provides a high-level overview of the process, including suppliers, inputs, process, outputs, and customers. |
Flowchart | Illustrates the steps in a process in a sequential manner, helping to document and analyze the process. |
Swimlane Chart | Categorizes process steps by roles or departments, highlighting responsibilities and potential bottlenecks. |
Analyze Phase
Find Inefficiencies
Teams analyze the process map to find inefficiencies. They use statistical methods such as hypothesis testing to determine if differences exist between process variables. Correlation and regression analysis help identify relationships and model dependencies. Design of Experiments (DOE) and process capability analysis provide deeper insights into process performance. Teams look for errors, bottlenecks, and steps that do not add value.
Hypothesis Testing
Correlation/Regression Analysis
Design of Experiments (DOE)
Process Capability Analysis
Root Cause Analysis
Teams use evidence-based techniques to identify root causes of inefficiencies. Qualitative methods include process maps, Gemba walks, and feedback from customers. Quantitative methods involve analyzing cycle times, defect rates, and satisfaction scores. Techniques like the 5 Whys and Fishbone Diagrams help teams dig deeper into problems. For example, a team used cycle time analysis to find a bottleneck in less than a week, leading to successful improvements. Gemba walks allow direct observation of work, revealing issues that data might miss.
Technique Type | Examples | Purpose |
|---|---|---|
Qualitative | Process maps, Gemba walks, VOC feedback | Understanding context, identifying issues, generating hypotheses |
Quantitative | Cycle times, defect rates, customer satisfaction scores | Establishing baseline performance, validating root causes, monitoring performance |
Six Sigma Process Mapping guides teams through these steps, helping them visualize workflows, collect meaningful data, and uncover root causes. This structured approach leads to targeted improvements and lasting results.
Improve Phase
Design Future State
Teams use the Improve phase to create a better version of the process. They start by selecting the process that needs improvement and define clear goals for the new design. Next, they identify the scope of each process step and collect data to understand what happens now. Teams plan and schedule resources, shifting focus from individual tasks to the entire process. They choose mapping techniques that fit the situation and review any previous documentation for insights.
To gather detailed information, teams conduct interviews with people involved in the process. They map the current process as it exists, noting important activities and any bottlenecks. After mapping, teams analyze and evaluate the process, looking for ways to remove waste and improve flow. They finalize the improvement plan and get approval from key stakeholders.
Tip: Teams should involve people from different departments to get a complete view of the process and ensure the new design works for everyone.
Steps for Designing the Future State:
Identify the scope and collect relevant data.
Plan and schedule resources for process-oriented roles.
Choose mapping techniques and review past documentation.
Conduct interviews for detailed process information.
Map the current process, highlighting key activities and bottlenecks.
Analyze, evaluate, and finalize the improvement plan.
Implement Changes
After designing the future state, teams move to implementation. They monitor process improvement efforts to make sure changes meet performance goals. Teams arrange activities in a logical order to visualize the new workflow and spot any remaining bottlenecks. They review and validate the process map by gathering feedback from stakeholders and comparing it with real operations.
Teams analyze the process to find more opportunities for improvement. They prioritize changes that align with business goals and are easy to implement. Pilot testing helps teams see if the changes work before making them permanent. Teams track key performance indicators to measure success.
Use visual tools and direct observation to find hidden bottlenecks.
Prioritize improvements that support business goals and are simple to apply.
Engage stakeholders to make sure changes last and have support.
Note: Teams should communicate clearly with everyone involved to build support and keep the project on track.
Control Phase
Monitor Performance
The Control phase helps teams make sure improvements last. They use control charts to track process performance over time. These charts show if the process stays stable or if problems return. Teams use I-MR charts to monitor individual measurements and moving ranges. P charts help track the proportion of defective items in a sample. By watching these metrics, teams can quickly spot issues and take action.
Common metrics for monitoring performance include:
Control charts (Statistical Process Control)
P charts for defect rates
Teams use these tools to keep the process running smoothly and maintain gains from Six Sigma Process Mapping.
Sustain Improvements
Sustaining improvements requires a structured approach. Teams set up a continuous improvement framework that outlines the tools and methods for ongoing progress. They define key performance indicators linked to strategic goals to track results. Comprehensive assessments help teams find new areas for optimization. Teams prioritize projects based on impact and alignment with business needs.
Employee engagement plays a big role in sustaining improvements. Teams involve staff at all levels to encourage innovation and ownership. Clear communication keeps everyone focused on continuous improvement. Training programs help employees build the skills needed to support new processes. Measurement systems ensure that progress continues over time.
Approach | Description |
|---|---|
Continuous Improvement Framework | Outlines processes, tools, and methods for ongoing improvement. |
Key Performance Indicators (KPIs) | Links measurable KPIs to strategic objectives for tracking progress. |
Comprehensive Assessments | Identifies inefficiencies and areas for further optimization. |
Prioritization of Opportunities | Focuses on projects with the greatest impact and alignment with goals. |
Project Plans | Details steps for implementing prioritized projects. |
Employee Engagement | Involves staff to foster a culture of improvement and innovation. |
Communication | Ensures everyone understands the importance of continuous improvement. |
Training Programs | Provides tiered training based on roles to enhance skills. |
Measurement Systems | Tracks progress to make sure improvements last. |
Tip: Teams should review progress regularly and adjust plans as needed to keep improvements on track.
Types of Process Maps
SIPOC Diagram
A SIPOC diagram stands as a foundational tool in Six Sigma process mapping. SIPOC represents Suppliers, Inputs, Process, Outputs, and Customers. Teams use this diagram to capture the entire process at a glance. The diagram helps clarify who provides inputs, what those inputs are, the steps involved, the outputs produced, and who receives them. This overview supports communication and collaboration across departments.
SIPOC diagrams allow teams to spot inefficiencies and bottlenecks quickly. By mapping the flow of inputs and outputs, organizations can optimize resources and reduce defects. Teams often use SIPOC diagrams at the start of improvement projects to define scope and align stakeholders.
Tip: SIPOC diagrams work best when teams need to understand the big picture before diving into details.
Industry Sector | Application Description | Outcomes Achieved |
|---|---|---|
Automotive Manufacturing | Mapped vehicle assembly, identified bottlenecks, optimized resources | Reduced defects, improved production efficiency |
Electronics Manufacturing | Mapped circuit board assembly, identified key inputs affecting quality | Significant defect reduction, improved reliability |
Financial Services | Mapped loan application process, streamlined steps, improved cross-department flow | Reduced turnaround time, enhanced customer satisfaction |
Hospitality | Analyzed guest check-in/out processes, optimized inputs and expectations | Improved guest experience and satisfaction |
Healthcare | Mapped patient admission process, identified bottlenecks | 30% reduction in dispensing errors, 20% fewer infections, reduced wait times |
Education | Analyzed student enrollment process, identified stakeholders | Improved communication, reduced administrative burden |
Teams in many industries have used SIPOC diagrams to improve communication, reduce variations, and achieve better outcomes.
High-Level Map
A high-level process map gives teams a broad overview of a process. This map focuses on the main stages or steps, leaving out detailed actions. Teams use high-level maps early in projects to help stakeholders understand the general flow and scope. The map shows how work moves from start to finish, highlighting major transitions.
High-level maps help teams define boundaries and set expectations. They make it easier to spot where the process begins and ends. Teams can use these maps to align everyone before moving to more detailed analysis.
Type of Process Map | Description | Purpose |
|---|---|---|
High-Level Process Map | Provides an overview of the process, focusing on major steps or stages | Used early in projects to help stakeholders understand the general flow and scope |
Note: High-level maps do not show every step. They serve as a guide for deeper exploration.
Detailed Map
A detailed process map breaks down every step and decision point in a process. Teams use this map to uncover root causes of problems and inefficiencies. The map includes all actions, choices, and flows, making it a powerful tool for analysis.
Detailed maps help teams find errors, delays, and waste. By examining each step, teams can identify where improvements are needed. This map supports targeted problem-solving and leads to lasting changes.
Type of Process Map | Description | Purpose |
|---|---|---|
Detailed Process Map | Breaks down the process into every single step and decision point | Used to identify root causes of problems and inefficiencies in the process |
Teams often start with a high-level map and then build a detailed map as they gather more information. This approach ensures that improvements address the right issues.
Tip: Use detailed maps when teams need to analyze complex processes and find specific areas for improvement.
Swimlane Diagram
A swimlane diagram organizes process steps into horizontal or vertical lanes. Each lane represents a department, team, or individual. This type of map helps teams see who does what at each stage of a process. Swimlane diagrams make complex processes easier to understand by showing how tasks move between different groups.
Teams use swimlane diagrams in Six Sigma projects to improve cross-functional processes. These diagrams highlight how work passes from one department to another. They also show where delays or confusion might happen. By using swimlane diagrams, teams can quickly spot problems that slow down the process.
The main advantages of swimlane diagrams include:
Advantage | Description |
|---|---|
Clarity of responsibility | Clearly shows which department or individual is responsible for each task. |
Improved communication | Highlights interactions between different functional areas, promoting better collaboration. |
Easier identification of inefficiencies | Visualizes the process across departments, making it easier to spot redundancies or unnecessary handoffs. |
Enhanced process analysis | Provides a comprehensive view of the process for effective analysis and optimization. |
Swimlane diagrams help teams assign responsibility for each step. They also make it easier to talk about how different groups work together. When teams see the whole process, they can find places where work gets stuck or repeated. This leads to better teamwork and faster problem-solving.
Tip: Teams should update swimlane diagrams often to reflect changes in roles or steps. This keeps the process map accurate and useful.
Value Stream Map
A value stream map (VSM) gives teams a big-picture view of how value flows through a process. This map shows every step, from the start to the finish, including both value-added and non-value-added activities. Teams use VSMs to find waste, delays, and steps that do not help the customer.
Value stream mapping works well in both manufacturing and service industries. Teams often discover that many delays come from too many approval steps. For example, a medium-sized service firm used VSM to find that most delays happened during approvals. After redesigning the process, they cut the number of required approvals by more than half. This change reduced administrative work and made employees feel more engaged because their tasks became less fragmented.
Value stream maps help organizations in several ways:
VSM helps teams see that real improvement comes from changing the structure of the value stream, not just working harder.
It gives leaders a clear model of the process, making it easier to analyze performance and spot inefficiencies.
Teams can use VSM to find and remove steps that do not add value, which leads to faster and smoother workflows.
Employees often feel more involved when they see how their work fits into the whole process.
Teams should use value stream maps to guide improvement projects and track progress over time. This approach supports continuous improvement and helps organizations reach their goals.
Efficiency Benefits

Visualizing Workflows
Six Sigma process mapping gives teams a clear view of how work moves through a system. By creating visual maps, teams can see each step, the people involved, and the flow of information. This approach helps everyone understand the process, which improves communication and reduces confusion. When teams see the workflow, they can spot gaps and overlaps that slow down progress.
Contribution Type | Explanation |
|---|---|
Enhances Communication | Creates a shared understanding of workflows, simplifying complex operations and ensuring consistency. |
Promotes Transparency | Visually represents workflows, clarifying roles and responsibilities, which fosters accountability. |
Streamlines Workflows | Identifies and eliminates non-value-added activities, optimizing processes and reducing waste. |
Aligns with Organizational Goals | Helps identify gaps between current operations and desired outcomes, ensuring activities support the mission. |
Clients at systems and teams have used process mapping to align their efforts. They report that visual tools make it easier to coordinate actions and set priorities. This shared understanding leads to faster decision-making and better results.
Identifying Waste
Process mapping helps teams find and remove waste from their workflows. By examining each step, teams can see where time, materials, or effort are lost. Common types of waste include unnecessary movement, waiting, overproduction, and defects. Teams use different types of maps to highlight these problems.
Process Map Type | Purpose |
|---|---|
Value Stream Map | Highlights both value-adding and non-value-adding steps to identify and eliminate wasteful steps. |
5S Map | Organizes and optimizes workspaces, showing before and after states to highlight improvements. |
Spaghetti Diagram | Traces physical movement to identify unnecessary movement and bottlenecks. |
Current State Map | Shows the existing process to highlight areas for improvement. |
Future State Map | Illustrates the envisioned optimized process after changes are implemented. |
Teams often find waste in the form of motion, waiting, overproduction, overprocessing, defects, and underused skills. For example, an aerospace parts manufacturer reduced machining cycle time by 46% and cut process variation by 80% after mapping their processes. Ford Motors achieved $2.19 billion in waste reduction and $1 billion in cost savings by focusing on waste elimination. These results show the power of process mapping in driving efficiency.
Simplifying Complexity
Complex processes can confuse teams and slow down progress. Six Sigma process mapping breaks down these processes into simple, easy-to-understand steps. Teams use visual tools to clarify roles, responsibilities, and handoffs. This clarity makes it easier to train new employees and maintain consistent performance.
Benefit | Explanation |
|---|---|
Improved Communication | Creates a shared understanding of workflows, simplifying operations and ensuring consistent interpretation. |
Enhanced Transparency | Visually represents workflows, clarifying roles and responsibilities, which promotes accountability. |
Streamlined Workflows | Identifies and eliminates non-value-added activities, optimizing processes and reducing waste. |
Helps align workflows with strategic objectives, ensuring every activity contributes to the organization's mission. |
Organizations report measurable gains after simplifying complex processes. Productivity often rises by 20-30%, defect rates drop by up to 40%, and operational costs fall by 15-25%. Teams at systems and teams have seen resource utilization improve by 30-40% and waste decrease by 20-30%. These improvements show that process mapping is a powerful tool for making work easier and more effective.
Supporting Training
Six Sigma process mapping plays a vital role in training and onboarding. Teams use process maps to create clear, standardized workflows. These visual guides help new employees understand their responsibilities and the sequence of tasks. Standardization ensures that every team member follows the same steps, which reduces confusion and mistakes.
New hires often struggle to learn complex processes. Process maps simplify this challenge. They show each step in a logical order. Employees can see how their actions fit into the larger workflow. This approach helps them reach full productivity faster.
Managers rely on process maps to measure performance. They compare employee actions against the standardized workflow. This makes it easier to spot areas for improvement. Teams can adjust training programs based on these findings.
Tip: Teams should update process maps regularly. This keeps training materials accurate and relevant.
Process mapping also supports ongoing learning. Employees use maps to refresh their knowledge. When processes change, updated maps help everyone stay informed. This reduces errors and keeps quality high.
The benefits of process mapping for training include:
New employees learn their roles quickly.
Teams reduce the time needed for onboarding.
Consistent processes allow for better performance measurement.
Updated maps support continuous learning.
Benefit | How Process Mapping Helps |
|---|---|
Standardization | Provides clear steps for every role |
Faster Onboarding | Helps new hires understand tasks quickly |
Reduced Training Time | Shortens the path to full productivity |
Performance Measurement | Enables managers to track and improve employee actions |
Continuous Improvement | Keeps training materials current and relevant |
Teams in many industries use process mapping to build strong training programs. Employees gain confidence when they see exactly what to do. Managers find it easier to coach and support their teams. This leads to higher productivity and fewer mistakes.
Process mapping creates a foundation for learning. It gives everyone a clear path to follow. As organizations grow, process maps help maintain quality and consistency. Training becomes more efficient, and employees adapt to changes with ease.
📘 Process maps are powerful tools for both new and experienced employees. They guide learning, support improvement, and help teams achieve their goals.
How to Create a Six Sigma Process Map
Choose the Process
Teams begin by selecting the process they want to map. This decision shapes the entire project. They look for processes that have the greatest impact on business goals. Teams often choose processes with high costs, long cycle times, or frequent errors. They also consider how changes will affect the organization.
The following table shows important criteria for choosing a process:
Criteria | Description |
|---|---|
Implementation cost | The financial resources required |
Time requirements | The duration needed for implementation |
Resource availability | The accessibility of necessary resources |
Expected benefits | The anticipated positive outcomes |
Risk factors | Potential challenges and uncertainties |
Organizational impact | The effect on the organization as a whole |
Teams review these factors before making a final choice. They select a process that offers the best chance for improvement and aligns with company strategy.
Tip: Teams should focus on processes that are visible, measurable, and important to customers.
Select Map Type
After choosing the process, teams decide which type of process map fits best. Each map serves a different purpose. A SIPOC diagram gives a high-level overview. A detailed map shows every step and decision point. Swimlane diagrams clarify roles and responsibilities. Value stream maps highlight value-added and non-value-added activities.
Teams match the map type to their goals. For example, a SIPOC diagram works well for defining scope at the start. A detailed map helps when teams need to find root causes of problems. Swimlane diagrams are useful for cross-functional processes. Value stream maps help teams see where waste occurs.
Teams may use more than one map during a project. They start with a high-level map, then add detail as they learn more.
Involve the Team
Successful Six Sigma Process Mapping depends on teamwork. Teams include people who know the process well. Subject matter experts (SMEs) help validate each step. Leaders select members who have the motivation, time, and energy to contribute. They also choose people with strong relationships across departments.
Best practices for involving teams include:
Align on one business problem.
Build a clear project charter.
Set decision rights for each member.
Use common terminology.
Run DMAIC as a cross-functional framework.
Manage communication carefully.
Add shared dashboards and standard work.
Resolve conflicts constructively.
Focus on building team capability.
Teams foster open communication and respect different viewpoints. They use visual tools to keep everyone aligned. Leaders rotate responsibilities to encourage shared ownership. Frequent updates help maintain alignment. Celebrating small wins keeps motivation high.
Note: Early engagement of sponsors ensures resources and support for the project.
Cross-functional teams bring diverse skills and perspectives. This approach leads to better process maps and stronger results.
Build the Map
Teams start building the process map by gathering all relevant information about the chosen process. They use sticky notes, whiteboards, or digital tools to lay out each step in the correct order. Each action, decision point, and handoff gets a place on the map. Teams label every step clearly so that everyone understands what happens at each stage.
A good process map includes the following elements:
Start and end points of the process
All major steps and activities
Decision points where choices occur
Inputs and outputs for each step
Roles or departments responsible for each action
Teams should keep the map simple and easy to follow. They avoid adding too much detail at first. If the map becomes too complex, it can confuse team members and slow down progress. Teams can add more detail later if needed.
During mapping sessions, teams encourage open discussion. They ask questions to clarify unclear steps. They check that everyone agrees on the sequence of actions. Teams use visual symbols, such as rectangles for tasks and diamonds for decisions, to make the map easy to read.
Common pitfalls can make process mapping less effective. Teams should watch out for these issues:
Team members who do not stay engaged or get distracted
Unclear problem statements that confuse the mapping effort
Lack of agreement on what value the process should deliver
Poor facilitation that leads to off-topic discussions, sometimes called "rabbit holes"
Mapping the process at the wrong level of detail
Spending too much time on small details and losing focus
Overlooking key stakeholders, which can lead to an incomplete map
Confusing inputs and outputs, especially in SIPOC diagrams
Neglecting customer requirements, which can result in misaligned processes
Trying to create a perfect map instead of focusing on practical improvement
Tip: Teams should focus on building a map that helps solve the main problem. They should avoid getting stuck on minor details.
After the first draft, teams review the map together. They check for missing steps or unclear areas. They ask stakeholders for feedback to make sure the map matches real-life operations. Teams update the map as needed to reflect the best understanding of the process.
Six Sigma Process Mapping works best when teams keep the map clear, involve the right people, and stay focused on the main goals. This approach helps organizations see their processes clearly and find ways to improve.
Best Practices for Process Mapping
Keep It Simple
Teams achieve better results when they keep process maps simple. A clear map helps everyone understand the steps without confusion. Simple maps use easy-to-read symbols and short descriptions. They avoid unnecessary details that can distract from the main process. When teams focus on the most important steps, they make it easier to spot problems and find solutions.
Tip: Simple maps help new team members learn faster and reduce mistakes.
A simple process map often includes:
Start and end points
Main steps in the process
Key decision points
Clear labels for each action
Teams should review their maps to remove extra steps or unclear language. This practice keeps the map useful for everyone.
Update Regularly
Process maps must stay current to remain effective. Teams should review and update their maps whenever the process changes. Regular updates help teams avoid errors and make it easier to adopt improvements. When teams update maps often, they keep everyone on the same page.
Updated maps reflect real-life operations.
Teams spot new problems quickly.
Changes become part of the routine.
Management support plays a big role in this practice. Leaders encourage teams to keep maps up to date. They provide resources and time for regular reviews. Teams that update their maps regularly see faster results and fewer mistakes.
Note: Embedding process mapping into daily routines helps teams maintain improvements over time.
Use Cross-Functional Teams
Cross-functional teams bring together people from different departments. Each member shares unique knowledge about the process. This approach leads to better maps and stronger results. When teams include a variety of roles, they see the process from many angles.
Benefit | Description |
|---|---|
Broader perspective | Teams identify more issues and opportunities. |
Better communication | Members share information across departments. |
Stronger solutions | Teams create improvements that work for everyone. |
Training team members on process mapping increases system effectiveness. When everyone understands how to build and use maps, the whole organization benefits. Management support motivates teams to stay engaged and keep improving.
Teams that work together across functions build trust and achieve lasting improvements.
By following these best practices, organizations create process maps that drive real change. Simple, current, and collaborative maps help teams reach their goals and maintain high performance.
Link to Continuous Improvement
Teams that use process mapping in Six Sigma projects often see the greatest benefits when they connect their maps to continuous improvement efforts. Continuous improvement means making small, regular changes that help processes work better over time. Process maps give teams a clear view of how work happens. This view helps them spot problems and find ways to improve.
A strong link between process mapping and continuous improvement creates a cycle of progress. Teams use maps to check if changes work as planned. They update maps when they find better ways to do things. This habit keeps everyone focused on making things better, not just fixing problems once.
Tip: Teams should treat process maps as living documents. They should update them after every improvement.
The following table shows how process mapping supports continuous improvement:
Process Mapping Practice | Continuous Improvement Benefit |
|---|---|
Regular map reviews | Teams find new problems quickly |
Visualizing workflows | Teams see where waste or delays happen |
Tracking changes | Teams measure if improvements work |
Involving all team members | Teams get more ideas for better solutions |
Standardizing steps | Teams keep quality high and reduce mistakes |
Teams can follow these steps to link process mapping with continuous improvement:
Review process maps on a set schedule, such as every month or quarter.
Ask team members for feedback about what works and what does not.
Use data from the process to measure results after changes.
Update the map to show new steps or better ways of working.
Share the updated map with everyone who uses the process.
Teams that link process mapping to continuous improvement build a culture of learning. They encourage everyone to look for ways to make work easier and faster. This approach helps organizations stay competitive and adapt to new challenges.
📈 Continuous improvement works best when teams use process maps to guide their efforts. Small changes add up to big results over time.
Process mapping also helps teams avoid slipping back into old habits. When everyone follows the latest map, improvements last longer. Leaders can use maps to train new employees and keep standards high.
Six Sigma Process Mapping helps teams see their work clearly and take action to improve. Teams that work together and update their maps often find more success. Small changes can lead to big results over time. Readers can start mapping their own processes to drive continuous improvement. For those who want to learn more or achieve similar results, they can reach out to systems and teams for guidance.
FAQ
What is the main goal of Six Sigma process mapping?
Six Sigma process mapping helps teams see every step in a process. They use it to find waste, improve quality, and make work easier. This tool supports better decision-making and helps organizations reach their goals.
How does process mapping help identify waste?
Teams use process maps to spot steps that do not add value. They look for delays, extra movement, or repeated work. By removing these wastes, teams make processes faster and more efficient.
Which process map should a team use first?
Most teams start with a SIPOC diagram. This map gives a high-level view of the process. It helps everyone understand the main steps, inputs, and outputs before moving to more detailed maps.
Who should participate in process mapping?
Cross-functional teams work best. They include people from different departments who know the process well. Each member shares unique knowledge, which leads to better maps and stronger results.
How often should teams update process maps?
Teams should update process maps whenever the process changes. Regular reviews keep maps accurate and useful. Updated maps help teams avoid mistakes and support continuous improvement.
Can process mapping improve training for new employees?
Yes. Process maps show each step in a clear order. New employees learn faster and make fewer mistakes. Managers use maps to measure performance and guide training.
What tools do teams use to create process maps?
Teams use sticky notes, whiteboards, or digital tools like flowchart software. They choose the tool that fits their needs and makes the map easy to share and update.
Is process mapping only for manufacturing?
No. Teams in healthcare, finance, education, and many other fields use process mapping. Any organization can use it to improve workflows and achieve better results.


