Implementing Lean Six Sigma Process Mapping for Lasting Results

Lean Six Sigma Process Mapping gives organizations a clear path to lasting improvement. Teams use this methodology to visualize workflows, spot waste, and make better use of resources. Systems that rely on process mapping often see stronger results and more consistent performance. Teams learn to focus on what matters most and avoid repeating mistakes. For more details or support, clients can reach out to learn how this approach works best for their systems and teams.
Key Takeaways
Lean Six Sigma Process Mapping helps teams visualize workflows to spot waste and improve efficiency.
Clear process maps align daily work with business goals and support tracking progress with measurable metrics.
Using digital tools speeds up mapping, enables real-time updates, and supports lasting improvements.
Avoid quick fixes by focusing on detailed process steps to find root causes and build long-term success.
Different map types like SIPOC, flowcharts, swimlanes, and value stream maps serve unique purposes in understanding processes.
Regularly reviewing and updating process maps keeps workflows accurate and supports continuous improvement.
Strong team collaboration and management support boost communication, accountability, and sustained results.
Embedding process mapping into daily routines helps teams adapt quickly and maintain high performance.
Lasting Improvement with Process Mapping
Roadmap for Success
A clear process map acts as a roadmap for teams and systems. It guides each step, making sure everyone understands their roles and responsibilities. When organizations document their process maps and connect them to measurable goals, they align daily actions with larger business objectives. This alignment helps teams track progress using key performance indicators (KPIs) such as task completion times, employee productivity, and customer satisfaction. By monitoring these metrics, organizations can see real improvements and adjust their strategies as needed.
Tip: Teams that use process maps with defined metrics can quickly spot areas for improvement and celebrate successes.
The following table shows how different organizations have achieved measurable improvements by using process mapping:
Industry Sector | Organization | Improvement Metric | Quantitative Result |
|---|---|---|---|
Manufacturing | Toyota | Defect reduction | 45% reduction |
Manufacturing | General Electric | Inspection time reduction | 75% reduction |
Healthcare | Mayo Clinic | Patient wait time reduction | 35% reduction |
Financial Services | JPMorgan Chase | Fraud detection accuracy improvement | 35% increase |
Retail | Amazon | Order processing time reduction | 50% reduction |
Retail | Walmart | Out-of-stock incident reduction | 40% reduction |
These results show that process mapping leads to lasting improvements across many industries.
Sustainable Change
Sustainable change means improvements last over time, not just for a few weeks or months. Digital process mapping tools help teams update and share process maps quickly. For example, creating an initial process map with digital tools takes only one hour, compared to four hours with traditional methods. Updates and team collaboration happen in real time, which keeps everyone on the same page and supports continuous improvement.
Research shows that combining process mapping with strong change management makes projects seven times more likely to succeed. Teams that follow structured models, such as ADKAR (Awareness, Desire, Knowledge, Ability, Reinforcement), support each member through change. This approach ensures that improvements stick and systems continue to perform well.
Note: Sustainable change depends on both clear process maps and support for the people involved.
Avoiding Short-Term Fixes
Short-term fixes may solve problems quickly, but they often create new issues later. Teams that focus only on immediate results risk missing deeper problems in their systems. Studies highlight several risks of relying on short-term fixes:
Outcome-based approaches can be gamed, leading to misalignment with true goals.
Supervising process steps is safer for long-term tasks, especially when outcome data is limited.
Focusing on process allows teams to understand and control each part, reducing risks from unclear or "black-box" systems.
Success in complex projects often depends on well-understood, step-by-step processes, not just quick results.
Short-term fixes may overlook deeper issues, while thorough process mapping supports careful evaluation and lasting solutions.
By using process mapping, organizations can avoid these pitfalls and build a foundation for long-term success. Teams and systems that want to learn more about these methods can reach out for guidance on how to apply them effectively.
Lean Six Sigma Process Mapping Essentials

What Is Process Mapping?
Process mapping creates a visual diagram of each step in a workflow. Teams use these diagrams to see how work moves from start to finish. Each step, decision point, and handoff appears clearly, making it easier to spot where things slow down or go wrong. In Lean Six Sigma Process Mapping, teams often use tools like flowcharts, value stream maps, and SIPOC diagrams. These tools help systems and teams document the "as-is" process, which means showing how things work right now before making changes.
Process mapping acts as a shared language for teams. It helps everyone understand the process, even if they work in different departments.
Across industries, process mapping has helped organizations find and fix bottlenecks. For example, in manufacturing, teams have used process maps to cut cycle times by 25% and save thousands of dollars each year. Healthcare systems have mapped patient admission steps, reducing wait times from over two hours to just 45 minutes. These results show that process mapping can lead to real, measurable improvements.
Why It Matters
Process mapping matters because it makes hidden problems visible. When teams see every step, they can identify waste, delays, and errors that might otherwise go unnoticed. This approach supports data-driven decisions and helps teams focus on what truly adds value for customers. Lean Six Sigma Process Mapping combines Lean’s focus on removing waste with Six Sigma’s goal of reducing defects and variation. The DMAIC (Define, Measure, Analyze, Improve, Control) method guides teams through each stage of improvement.
Process maps reveal inefficiencies, waste, and bottlenecks.
Teams can measure delays, wait times, and compliance gaps.
Mapping supports better communication and collaboration.
Continuous updates keep processes aligned with business goals.
Systems and teams that use process mapping often see faster delivery times, lower costs, and higher customer satisfaction. For example, marketing teams have reduced delivery times by 30%, and healthcare providers have cut patient wait times by 20%. These improvements come from involving everyone in the mapping process and using modern tools to keep maps up to date.
Key Principles
Several core principles guide successful process mapping in Lean Six Sigma:
Customer Focus: Teams start by understanding what customers value most. This ensures that process maps target the right areas for improvement.
Data-Driven Decisions: Teams use facts and metrics, not guesses, to find root causes and measure progress.
Continuous Improvement: Regularly updating process maps helps teams adapt to changes and keep improving.
Collaboration: Involving cross-functional teams uncovers hidden issues and builds shared ownership.
Alignment with Goals: Every mapped step should support the organization’s main objectives.
Principle | Benefit |
|---|---|
Customer Focus | Improves satisfaction and quality |
Data-Driven Decisions | Ensures accurate problem-solving |
Continuous Improvement | Keeps processes efficient and relevant |
Collaboration | Builds teamwork and shared understanding |
Goal Alignment | Connects daily work to business success |
Teams that follow these principles achieve better results and sustain improvements over time. Systems and teams interested in learning more about these methods can reach out for guidance on how to apply them effectively.
Benefits of Lean Six Sigma Process Mapping
Process Visibility
Process visibility stands as one of the most important benefits of Lean Six Sigma Process Mapping. When systems and teams create visual diagrams of their workflows, they gain a clear view of each step, decision point, and handoff. This transparency helps everyone understand how work moves through the organization. Teams can spot bottlenecks, delays, and areas where errors often occur.
Teams use measurable indicators like cycle time and cost analysis to monitor performance.
Value stream analysis and bottleneck identification highlight where processes slow down.
Quantitative data, combined with team experience, reveals gaps and inefficiencies.
Documentation of process variations helps teams see where actual workflows differ from intended ones.
For example, a project team found that redundant manual approvals and data entry duplication slowed down their process. By mapping these steps, they prioritized improvements based on effort and impact. This approach led to faster and more reliable workflows.
Process mapping outputs, such as cycle times and efficiency metrics, give organizations the data they need to make informed decisions and track progress over time.
Waste Reduction
Waste reduction is a core goal in Lean Six Sigma. Process mapping helps systems and teams identify and eliminate activities that do not add value. By making every step visible, teams can see where resources are wasted, such as unnecessary movement, waiting, or rework.
Organizations have reported measurable benefits after using process mapping. FedEx improved its aircraft maintenance process by identifying critical milestones and segmenting workflows. This change increased annual maintenance checks from 14 to 30 and reduced man-hours from 32,715 to 21,535. An automotive manufacturer used process mapping to optimize its assembly line, achieving a 15% reduction in production time while maintaining quality.
Impact Area | Measurable Outcome / Example |
|---|---|
Production Delays | |
Order Processing Time | 30% reduction through automation |
Onboarding Time | Reduced from 10 days to 5 days |
Dispensing Errors | 30% reduction in healthcare errors |
Hospital-Acquired Infections | 20% decrease in healthcare settings |
These results show that process mapping leads to significant improvements in efficiency and error reduction across different industries.
Continuous Improvement
Continuous improvement means making small, ongoing changes that add up to big results over time. Lean Six Sigma Process Mapping supports this by giving teams a clear way to track progress and measure success. Organizations that adopt this approach often see steady gains in productivity, quality, and customer satisfaction.
For example, Toyota, Motorola, and Danaher have all built cultures around continuous improvement. They track metrics like defect rates, lead times, and cost savings. Over time, these companies have reduced waste, improved quality, and increased efficiency. Sustaining these improvements requires leadership support, employee engagement, and regular training.
Company | Metrics Improved Over Time | Sustaining Factors |
|---|---|---|
Toyota | Reduced waste, improved quality | Just-in-time, respect for people culture |
Motorola | Fewer defects, higher satisfaction | Data-driven optimization, training |
Danaher | Profitable growth, efficiency | Kaizen, Lean, DBS methodologies |
Autoliv | Cost savings, better quality | Leadership support, multi-year efforts |
Systems and teams that want to build a culture of continuous improvement can use process mapping as a foundation. Regular monitoring, feedback, and adaptation help ensure that gains last. For more guidance on starting or sustaining these efforts, teams can reach out for support.
Team Collaboration
Strong team collaboration drives successful process improvement. When systems and teams use process mapping, they create a shared visual reference that everyone can understand. This common language helps team members see how their work connects with others. It also makes it easier to discuss tasks, set expectations, and solve problems together.
Teams benefit from improved visibility into workflows. Each member understands their role and responsibilities more clearly. This transparency reduces confusion and miscommunication. When everyone sees the same process map, they can spot gaps or overlaps in work. They can also suggest changes that make the process smoother for everyone.
Modern process mapping tools support real-time collaboration. Cloud-based platforms allow team members to access the latest process maps from any location. Team members can comment, suggest changes, and provide feedback instantly. This approach ensures that all perspectives are considered and that updates happen quickly.
Regular review and update of process maps keep them relevant and encourage ongoing teamwork. Scheduling feedback sessions and process reviews helps teams stay engaged and communicate openly.
Assigning responsibilities and setting clear timelines promotes accountability. When teams know who is responsible for each step, they work together more effectively. This structure also helps new team members get up to speed faster. For example, onboarding time can drop from 10 days to just 5 days when teams use process maps to guide training.
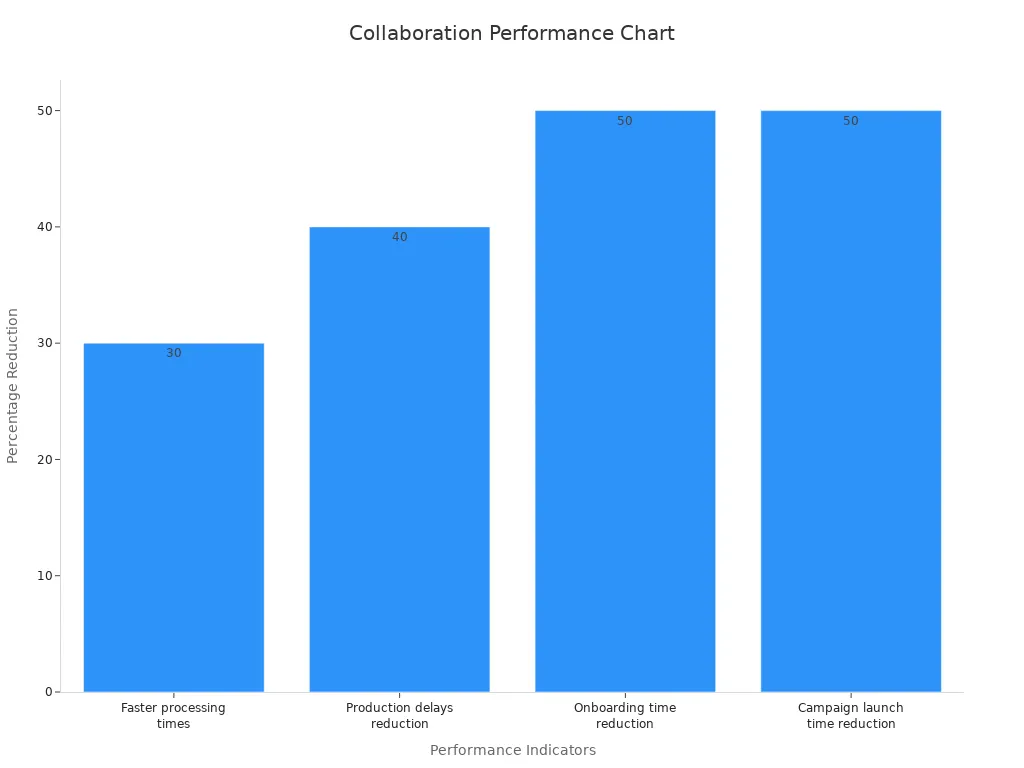
The following table highlights key performance indicators that show how process mapping enhances team collaboration:
Performance Indicator | Description / Impact | Example / Quantitative Result |
|---|---|---|
Improved clarity across departments | Enhances understanding and reduces miscommunication | - |
Reduced miscommunication | Streamlines communication between teams | - |
Faster processing times | Speeds up workflows and reduces delays | Order processing time reduced by 30% |
Increased team feedback & involvement | Encourages active participation in process improvements | - |
Shared visual references | Provides a common language and fosters collaboration | - |
Production delays reduction | Identifies inefficiencies and optimizes supply chain | Production delays reduced by 40% |
Onboarding time reduction | Streamlines HR processes for faster employee integration | Onboarding time cut in half (from 10 to 5 days) |
Campaign launch time reduction | Automates and optimizes marketing workflows | Campaign launch times reduced by 50% |
Continuous feedback loops | Maintains ongoing collaboration and process refinement | - |
Use of collaborative tools | Enables real-time commenting, suggestions, and feedback | - |
Teams that use process mapping report higher job satisfaction and stronger engagement. They feel more confident in their work and more connected to their colleagues. Systems and teams that want to build a culture of collaboration can start by mapping their processes together. For more guidance on using these methods, teams can reach out for support.
Types of Process Maps
SIPOC
Use Cases
SIPOC diagrams give a high-level overview of a process by showing Suppliers, Inputs, Process, Outputs, and Customers. Systems and teams use SIPOC when they need to define the boundaries of a process before diving into details. This tool works well at the start of improvement projects. For example, Tesla used SIPOC to map its vehicle ordering process. The team identified suppliers, inputs, and steps across manufacturing, design, trade-in, and financing. This approach helped align customer expectations and improved transparency.
Many industries benefit from SIPOC diagrams:
Industry Sector | Application Description | Outcomes Achieved |
|---|---|---|
Automotive Manufacturing | SIPOC mapped vehicle assembly, identified bottlenecks, optimized resources | Reduced defects, improved production efficiency |
Electronics Manufacturing | SIPOC mapped circuit board assembly, identified key inputs affecting quality | Significant defect reduction, improved reliability |
Financial Services | SIPOC mapped loan application process, streamlined steps, improved cross-department flow | Reduced turnaround time, enhanced customer satisfaction |
Hospitality | SIPOC analyzed guest check-in/out processes, optimized inputs and expectations | Improved guest experience and satisfaction |
Healthcare | SIPOC mapped patient admission process, identified bottlenecks | 30% reduction in dispensing errors, 20% fewer hospital infections, reduced wait times |
Education | SIPOC analyzed student enrollment process, identified stakeholders | Improved communication, reduced administrative burden |
A manufacturing company used SIPOC during the Define phase of a Six Sigma project. The team found that inconsistent input materials caused defects. After analysis and improvements, the company reduced defect rates by 30% and saved 15% in costs within six months.
Elements
A SIPOC diagram includes five main elements:
Suppliers: Who provides the inputs?
Inputs: What resources or information enter the process?
Process: What are the main steps?
Outputs: What products or services result?
Customers: Who receives the outputs?
SIPOC diagrams help systems and teams clarify process boundaries and identify key contributors. This clarity supports better communication and faster problem-solving.
Flowchart
Structure
Flowcharts use shapes and arrows to show the sequence of steps in a process. Each shape represents a different type of action, such as a task, decision, or start/end point. Arrows connect the shapes, showing the direction of flow. Teams often use rectangles for tasks, diamonds for decisions, and ovals for start or end points.
Documented Example | Purpose and Effectiveness | |
|---|---|---|
Flowchart | Product manager planning a customer survey using decision boxes (yes/no) | Simplifies understanding of sequential processes, aids communication, and highlights areas for process improvement. Easy for non-technical users to grasp. |
Flowcharts make it easy for everyone to follow the process, even if they have little technical knowledge.
Applications
Teams use flowcharts to plan, implement, and evaluate processes in many fields. In healthcare, flowcharts help map out patient care steps, track who is responsible, and identify bottlenecks. For example:
A lung cancer screening workflow used a flowchart to customize steps for different clinics. This made the process easier to follow and improved resource use.
The SCORE study mapped out colorectal cancer screening interventions with flowcharts. Teams used these diagrams to spot delays and optimize activities.
Flowcharts also help track time, resources, and challenges at each step. Teams can measure how long each step takes and where problems occur. This data supports ongoing improvements and helps systems and teams adapt processes for better results.
Swimlane
Roles
Swimlane diagrams organize process steps into lanes. Each lane represents a different person, team, or department. This layout shows who is responsible for each step. By dividing tasks into lanes, swimlane diagrams make ownership clear and reduce confusion.
They make handoffs between departments visible.
Teams can spot redundancies and streamline workflows.
Cross-Function
Swimlane diagrams work well for processes that involve many departments or roles. They help systems and teams see how work moves across functions. This clarity supports better collaboration and communication.
They highlight bottlenecks and inefficiencies.
Teams use data such as cycle time and error rates to measure improvements.
For example, a toy business used a swimlane diagram to manage customer service requests. Each lane showed the role of the customer, clerk, and service department. This helped standardize the process and improve response times.
Swimlane diagrams transform complex, cross-functional processes into clear, actionable steps. Systems and teams can use these diagrams to improve efficiency and accountability.
Value Stream Map
Value stream maps help systems and teams see every step in a process from start to finish. These maps show how work flows, where delays happen, and where waste occurs. By using value stream maps, teams can make better decisions and improve how they work together.
Value and Waste
A value stream map highlights both value-added and non-value-added steps. Teams use these maps to find activities that do not help the customer or the business. For example, waiting, extra movement, and rework often appear as waste. By making these steps visible, teams can focus on removing them.
Value stream maps show the entire workflow and key metrics.
Teams identify bottlenecks and inefficiencies using real data.
The maps support better communication and teamwork.
Teams track the impact of changes over time.
Quantitative metrics help guide decisions and measure progress.
Case studies show that value stream mapping leads to real improvements. In truck manufacturing, teams used value stream maps to increase productivity by 4%. They reached 95% overall productivity and reduced cycle times. Teams measured each step by tracking cycle times, wait times, and quality. This data helped them find and remove waste, making the process faster and more efficient.
Process Step | Cycle Time | Inventory Level | Wait Time |
|---|---|---|---|
Example A | 30 seconds | 10 units | 5 minutes |
Example B | 45 seconds | 15 units | 10 minutes |
This table shows how teams use value stream maps to collect detailed data at each step. These numbers help teams spot problems and make targeted improvements.
Teams that use value stream maps can document their progress and build a culture of continuous improvement.
Lean Focus
Value stream mapping supports Lean principles by helping teams focus on what matters most. Lean thinking aims to deliver value to the customer while removing anything that does not add value. Value stream maps make it easy to see which steps help the customer and which ones create waste.
Teams use value stream maps to:
Visualize the entire process from the customer’s point of view.
Identify steps that add value and those that do not.
Set goals for reducing waste and improving flow.
Track improvements and celebrate progress.
Systems and teams that use value stream maps often see better results. They improve communication, reduce delays, and make smarter decisions. These maps also help teams keep improving over time. For more information on how to use value stream maps, systems and teams can reach out for support.
Implementing Lean Six Sigma Process Mapping
Define Goals
Defining clear goals forms the foundation of any successful Lean Six Sigma Process Mapping initiative. Systems and teams begin by identifying what they want to achieve. They set specific objectives, such as reducing process delays, improving quality, or cutting costs. Teams often start by determining the process scope, including the start and end points, as well as the main inputs and outputs. This step ensures everyone understands the boundaries of the process.
A well-defined goal helps teams focus their efforts and measure progress. For example, a team may aim to reduce order processing time by 20% within six months. By setting measurable targets, teams can track improvements and adjust strategies as needed. Teams should also map the current state of the process, not an idealized version. This approach provides a realistic baseline and reveals gaps between how the process works and how people think it works.
Tip: Teams that define goals with clear metrics and realistic process maps are more likely to find actionable solutions and achieve lasting results.
Determine Scope
Determining the scope of the process map helps systems and teams avoid confusion and wasted effort. Teams decide which part of the process to review and where the process begins and ends. They identify the main activities, inputs, and outputs involved. This step prevents teams from mapping too much or too little, which can lead to missed problems or unnecessary complexity.
Teams often use high-level maps, such as SIPOC diagrams, to clarify the scope before diving into details. These diagrams show suppliers, inputs, processes, outputs, and customers. By defining the scope early, teams ensure that everyone shares the same understanding of the process boundaries.
Industry leaders like Kellogg have demonstrated the value of this approach. Their teams select specific subjects to benchmark, document current processes, and measure performance gaps. This structured method leads to operational improvements and risk reduction.
Identify Steps
After setting goals and defining the scope, systems and teams list all the steps in the process. They arrange these steps in the correct order, making sure to include every action, decision point, and handoff. Teams often walk through the process together, using input from different departments to capture the full picture.
Accurate step identification is critical. Teams should focus on mapping the current state, not an ideal process. This helps reveal pain points, redundancies, and delays that might otherwise go unnoticed. Teams may use different types of process maps, such as flowcharts or swimlane diagrams, depending on the complexity of the process.
Teams that involve members from across the organization gain a deeper understanding of the process and uncover hidden issues. Regular reviews and feedback sessions help ensure the map reflects reality.
By following these steps, systems and teams create a strong foundation for Lean Six Sigma Process Mapping. This approach supports data-driven decisions and continuous improvement. Teams interested in learning more about these methods can reach out for further guidance.
Map Current State
Mapping the current state gives systems and teams a clear picture of how work happens right now. Teams gather information by observing the process, talking to people involved, and reviewing existing documents. They use tools like flowcharts, swimlane diagrams, or value stream maps to show each step, decision, and handoff. This visual map helps everyone see where problems or delays occur.
Teams should focus on facts, not opinions. They record what actually happens, not what should happen. This honest approach uncovers hidden issues and shows where waste or errors exist. For example, a team might find that a task takes longer than expected because of repeated approvals. By mapping the current state, teams can measure how long each step takes and where resources get used.
Tip: Teams that involve people from every part of the process create more accurate maps. This teamwork leads to better results.
Mapping the current state forms the foundation for Lean Six Sigma Process Mapping. It sets the stage for finding and fixing problems. Systems and teams that want to learn more about mapping techniques can reach out for guidance.
Review and Feedback
After mapping the current state, systems and teams review the process map for accuracy. They invite feedback from everyone involved in the process. This step ensures the map matches reality and includes all important details.
Teams hold review sessions where members walk through each step together. They ask questions like, "Does this step happen every time?" or "Are there exceptions we missed?" Feedback helps spot mistakes, missing steps, or unclear areas. Teams update the map based on these discussions.
Open communication builds trust and encourages people to share their ideas. When everyone feels heard, teams find more opportunities for improvement. Using digital tools makes it easy to collect comments and update the map in real time.
Note: Regular reviews keep process maps up to date and useful for everyone.
Systems and teams that want to improve their review process can reach out for support and best practices.
Analyze for Improvement
Once the process map is accurate, systems and teams analyze it to find areas for improvement. They look for steps that cause delays, waste resources, or create errors. Teams use data from the map, such as cycle times and error rates, to guide their analysis.
Common problems include unnecessary steps, repeated tasks, or unclear handoffs. Teams ask questions like, "Which steps add value for the customer?" and "Where do mistakes happen most often?" They use Lean Six Sigma Process Mapping to focus on removing waste and reducing variation.
Teams brainstorm solutions and test small changes to see what works best. They measure results and adjust their approach as needed. This cycle of analysis and improvement leads to better quality, faster delivery, and lower costs.
Teams that analyze their process maps regularly build a culture of continuous improvement.
Systems and teams interested in learning more about analyzing process maps can reach out for expert advice.
Update Process
Updating the process map marks a critical step for systems and teams seeking lasting improvement. After analyzing the current state and identifying changes, teams must revise their process maps to reflect new workflows. This update ensures that everyone follows the same steps and understands the latest procedures.
Teams should document every change clearly. They can use digital tools to make updates visible to all members. When teams update process maps, they help prevent confusion and reduce the risk of returning to old habits. Updated maps also serve as training materials for new team members.
A good update process includes these steps:
Document Changes
Teams record each improvement or adjustment. They use clear language and simple visuals to show what has changed.Communicate Updates
Teams share the revised process map with everyone involved. They hold meetings or send notifications to explain the changes.Train Team Members
Training ensures that all members understand the new process. Teams may use workshops, quick guides, or hands-on practice.Monitor Implementation
Teams track how well the new process works. They collect feedback and measure results using key performance indicators.Schedule Regular Reviews
Teams set times to review the process map. Regular reviews help catch new issues and keep the process up to date.
Tip: Teams that update their process maps regularly see fewer errors and faster adoption of improvements.
The table below shows how updating process maps benefits systems and teams:
Benefit | Description | Example Outcome |
|---|---|---|
Improved compliance | Everyone follows the same steps | Fewer mistakes in daily tasks |
Faster onboarding | New members learn the process quickly | Training time cut in half |
Better communication | Teams understand changes right away | Less confusion and fewer delays |
Sustained improvements | Changes last longer and deliver results | Higher quality and efficiency |
Systems and teams that want to achieve lasting results should treat process map updates as an ongoing practice. They should involve all members in the update process and encourage open feedback. For more guidance on updating process maps or building a culture of continuous improvement, systems and teams can reach out for expert support.
Sustaining Results
Regular Reviews
Regular reviews help systems and teams keep their processes effective and up to date. When teams review process maps often, they can spot problems before they grow. These reviews allow everyone to see if the process still matches daily work. Teams can compare current results to past performance and make changes when needed.
Many organizations see big improvements by holding regular reviews. For example, teams that review and update their process maps often achieve a 30% reduction in cycle times and a 30% increase in throughput. Equipment works better, with a 25% increase in effectiveness. Production time drops by 15%. These gains happen because teams use process maps as a baseline to measure progress and find areas that need attention.
Teams should track key metrics like cycle time, throughput, and customer satisfaction. By watching these numbers, they know when to make changes. Regular meetings with everyone involved help keep the process map accurate. When teams work together to update maps, they build trust and make sure everyone understands the changes.
Tip: Schedule process reviews every quarter or after major changes. This keeps the process map useful and helps teams stay on track.
Team Training
Training gives team members the skills they need to use process maps well. When everyone knows how to read and update process maps, the whole system works better. Training should cover the basics of process mapping, how to spot waste, and how to suggest improvements.
New team members learn faster when they see clear process maps. Training sessions can include hands-on practice, group discussions, and real examples from the team's own work. Teams that train together build stronger connections and share ideas more easily.
Ongoing training keeps skills sharp. As processes change, teams need to learn new steps or tools. Regular workshops or short refresher courses help everyone stay up to date. Teams that invest in training see fewer mistakes and faster adoption of new methods.
Training topics to consider:
How to create and read process maps
Ways to identify waste and bottlenecks
Steps for updating process maps
Using digital tools for collaboration
Note: Systems and teams that want to improve their training programs can reach out for advice on best practices.
Management Support
Management support plays a key role in sustaining process improvements. Leaders set the tone by showing that process mapping matters. When managers join review meetings and support training, teams feel more confident about making changes.
Leaders should provide the resources teams need, such as time for reviews and access to digital tools. They can help remove barriers that slow down improvement efforts. Managers also encourage open communication, so team members feel safe sharing ideas or concerns.
Strong management support leads to better results. Teams stay motivated when they know leaders value their work. Managers can celebrate successes and recognize team achievements. This support helps teams keep improving, even when challenges arise.
Managers who support process mapping help build a culture of continuous improvement. Systems and teams can reach out to learn more about gaining leadership buy-in.
Daily Practice
Embedding process mapping into daily routines helps systems and teams maintain improvements over time. Teams that use process maps every day make better decisions and solve problems faster. They see process mapping as a living tool, not just a one-time project. This approach keeps everyone focused on quality and efficiency.
Teams can start by making process maps part of daily meetings. For example, they can review a process map during a morning huddle. This habit helps everyone remember the correct steps and spot issues early. When a problem appears, teams can update the map right away. This keeps the process current and useful.
Many systems and teams use visual boards or digital dashboards to display process maps. These tools make it easy for everyone to see the workflow. Team members can add notes or suggestions directly on the map. This practice encourages open communication and quick feedback.
Tip: Teams that update their process maps daily respond to changes faster and avoid repeating mistakes.
Leaders play a key role in making process mapping a daily habit. They can set expectations by asking teams to use process maps when planning tasks or solving problems. Leaders can also recognize teams that use process mapping well. This recognition builds a culture where everyone values continuous improvement.
The table below shows simple ways to make process mapping part of daily work:
Daily Practice | How It Helps Teams | Example Activity |
|---|---|---|
Morning process map review | Keeps everyone aligned | Review steps at daily huddle |
Real-time map updates | Ensures accuracy and relevance | Edit map after process change |
Visual boards or dashboards | Improves visibility and engagement | Display maps in team area |
Team feedback sessions | Encourages open communication | Collect suggestions weekly |
Leader recognition | Builds motivation and accountability | Celebrate process improvements |
Systems and teams that treat process mapping as a daily practice see stronger results. They adapt quickly to new challenges and maintain high standards. Teams interested in learning more about daily process mapping can reach out for expert support and resources.
Systems and teams that commit to regular process mapping achieve lasting improvements. Ongoing reviews, team engagement, and leadership support drive measurable gains in quality, efficiency, and employee satisfaction. The table below highlights key metrics that leading organizations use to sustain results:
Metric Category | Example Metrics |
|---|---|
Daily Quality Metrics | Daily tracking of quality and output |
Operational Efficiency | Cycle time, productivity, waste |
Employee Engagement | Participation rates, satisfaction |
Review Practices | Regular reporting and adjustments |
Teams that want to build a culture of continuous improvement can reach out for guidance on integrating these practices.
FAQ
What is the main purpose of Lean Six Sigma process mapping?
Lean Six Sigma process mapping helps systems and teams visualize workflows. This method identifies waste, reduces errors, and supports continuous improvement. Teams use process maps to align daily actions with business goals.
How often should systems and teams update their process maps?
Teams should review and update process maps after major changes or at least every quarter. Regular updates ensure accuracy and help teams maintain improvements over time.
Which process map should a team use first?
Most systems and teams start with a SIPOC diagram. This high-level map defines process boundaries and clarifies suppliers, inputs, outputs, and customers before moving to detailed mapping.
Can process mapping help cross-functional teams?
Yes. Process mapping clarifies roles and handoffs between departments. Teams use swimlane diagrams to improve communication and reduce confusion in cross-functional workflows.
What digital tools support Lean Six Sigma process mapping?
Teams use digital tools like Lucidchart, Microsoft Visio, or Miro. These platforms allow real-time collaboration, easy updates, and secure sharing of process maps.
How does process mapping support continuous improvement?
Process mapping gives teams a clear view of current workflows. Teams use this information to spot problems, test solutions, and measure results. Regular analysis leads to ongoing improvements.
Who should participate in process mapping sessions?
All members involved in the process should join mapping sessions. Cross-functional participation ensures accuracy and uncovers hidden issues. Teams that include everyone achieve better results.
Where can systems and teams get more guidance on process mapping?
Teams can reach out to our experts for support, resources, or training. Guidance helps systems and teams apply process mapping effectively and achieve lasting results.


