Mastering Business Process Mapping for Better Results
Business Process Mapping transforms complex operations into clear visuals, allowing teams to understand each step with ease. Visualizing workflows brings several advantages:
Teams can spot inefficiencies and bottlenecks quickly, leading to timely improvements.
Collaboration improves as roles and responsibilities become clear, which reduces miscommunication.
Regular reviews help teams stay aligned and detect issues early.
Companies that use process visualization often see better results in areas like Hiring Systems and overall Optimization Steps. This approach helps organizations break down tasks, enhance productivity, and support continuous improvement.
Key Takeaways
Business process mapping turns complex workflows into clear visuals that help teams spot problems and improve efficiency.
Mapping processes clarifies roles and responsibilities, which boosts communication and teamwork across departments.
Using process maps supports better decision-making by showing where improvements are needed and aligning work with goals.
Regularly updating process maps keeps workflows current and helps organizations adapt to changes quickly.
Different types of maps like flowcharts, swimlane diagrams, value stream maps, and SIPOC serve unique purposes for various processes.
Following best practices, such as involving all stakeholders and using standard symbols, ensures accurate and useful maps.
Specialized software and templates make creating and sharing process maps easier and more consistent.
Training in process mapping builds skills and confidence, helping teams apply mapping tools effectively for ongoing improvement.
Why Business Process Mapping
Purpose
Organizations use business process mapping to bring clarity and order to their operations. When teams visualize workflows, they prevent confusion and chaos that can arise when employees create their own versions of tasks. Standardizing processes helps everyone follow the same steps, which reduces mistakes and saves time.
Teams use process maps to spot and fix revenue leaks or gaps that often hide in daily routines.
Mapping helps uncover inefficiencies and breakdowns that slow down work.
Clear documentation shows who is responsible for each task and what tools they use.
Employees feel less frustrated and burned out when they follow efficient, well-defined processes.
Business process mapping gives organizations a clear picture of how work gets done. This shared understanding helps teams align their efforts and work toward common goals.
Value
Business process mapping delivers measurable value by improving how organizations operate. It helps leaders and teams focus on what matters most and make better decisions.
Process maps highlight key workflows that impact revenue and efficiency. Removing obstacles in these areas leads to faster growth.
Standardized processes promote transparency and reduce errors, making it easier for teams to communicate and collaborate.
Visual documentation supports training and onboarding, helping new employees learn tasks quickly.
Regular reviews of process maps keep them aligned with changing strategies and goals.
Organizations use metrics like time, cost, and performance indicators to track improvements and measure success.
“The first process selected to be mapped should be the largest pain point in the business which restricts revenue generation. Every business is going to have obstacles and pain points to have growth. An efficiently run business is a successful business and successful businesses have significant revenue. Revenue generation keeps the business moving forward so a company should want to remove all obstacles slowing the acquisition of revenue.” — Ray McKenzie, Founder and Principal of Red Beach Advisors
Business process mapping supports ongoing improvement and helps organizations adapt to change. By connecting high-level strategies with daily tasks, companies create a strong foundation for growth and innovation.
Key Benefits
Efficiency
Business process mapping increases efficiency by making every step of a workflow visible. Teams can quickly spot tasks that waste time or duplicate effort. When organizations map their processes, they often find hidden bottlenecks and areas where resources are underused. For example, a company that mapped over 40 processes and 700 tasks discovered ways to reduce friction and improve client satisfaction. By holding cross-functional workshops, teams identified more than two dozen improvements, leading to annual cost savings of over $5 million.
Process mapping also supports automation. When teams see which steps add little value, they can automate those tasks and focus on more important work. This approach reduces turnaround times and helps employees avoid burnout. Regular reviews of process maps keep workflows up to date and support continuous improvement. Companies that use these methods often see faster growth and better performance.
Tip: Continuous monitoring and regular updates to process maps help organizations stay efficient and adapt to changes quickly.
Communication
Clear communication stands as one of the strongest benefits of business process mapping. Process maps give everyone a shared reference, making it easier for teams to understand each step and their own responsibilities. This shared understanding reduces miscommunication and errors. When new employees join, process maps help them learn faster and feel confident in their roles.
Teams that use process mapping tools often report better collaboration. Visual workflows create a common language, so everyone knows what to expect. Internal collaboration improves because roles and tasks are clear. Integration with technology allows real-time updates, which helps remote teams stay connected.
Process maps:
Serve as onboarding tools
Reduce confusion with visual workflows
Foster collaboration across departments
Decision-Making
Business process mapping supports better decision-making by providing a clear view of how work gets done. Leaders can see where inefficiencies exist and make informed choices about where to improve. Visualizing workflows helps align daily activities with strategic goals, so teams work toward the same objectives.
Mapping also encourages accountability. When everyone understands their role, teams can respond to changes faster and with more confidence. Decision maps, such as flowcharts and decision trees, help organizations analyze complex choices and identify the best path forward. Regular reviews of these maps support ongoing improvement and adaptability.
Note: Data-driven decisions become easier when organizations use process maps to track performance and spot trends. This leads to smarter resource allocation and stronger results.
Transparency
Transparency stands as a cornerstone of successful business process mapping. When organizations map their processes, they make every step visible to all team members. This openness builds trust and accountability, as everyone can see how work flows from start to finish. Teams understand their roles and responsibilities, which reduces confusion and helps prevent mistakes.
Process mapping provides visual clarity. Teams can spot inefficiencies, bottlenecks, and redundancies quickly. When everyone sees the same workflow, it becomes easier to discuss problems and find solutions together. This shared understanding leads to better collaboration and stronger results.
Process maps make workflows clear and accessible to all stakeholders.
Teams can identify areas for improvement and make data-driven decisions.
Standardized processes reduce errors and improve efficiency.
Transparent maps simplify onboarding and training for new employees.
Organizations foster a culture of continuous feedback and improvement.
Leadership can use process maps to set clear operational baselines.
Transparency also supports compliance and risk management. When processes are visible, organizations can ensure they meet regulations and adapt to changes more easily. For example, Toyota reduced waste and production costs by 15% by making manufacturing steps visible to all employees. Spotify improved project completion rates by 40% through transparent agile processes. Patagonia increased customer loyalty by 20% by showing customers how their products are made.
Transparent process mapping not only highlights what works but also reveals what needs fixing. This openness encourages teams to share feedback and suggest improvements, driving ongoing success.
Challenges can arise, such as resistance to change or concerns about data security. Organizations can address these issues by communicating clearly, simplifying complex processes, and managing change effectively. Lessons from companies like Nokia, GE, and Xerox show that strong communication and simplicity are key to successful transparency initiatives.
Types of Process Maps
Flowcharts
Flowcharts use standardized symbols to show each step in a process. These symbols include rectangles for actions, diamonds for decisions, and arrows for flow direction. Flowcharts break down complex workflows into simple, visual steps. Teams often use them to understand how a process works from start to finish.
When to Use Flowcharts:
To improve team communication.
To identify bottlenecks or inefficiencies.
To plan different scenarios or changes.
To train new employees with clear visuals.
For example, a customer support team might use a flowchart to map out how they handle incoming requests. The chart starts with receiving a ticket, then moves to checking the issue, assigning it to the right person, and finally resolving the problem. Each step appears as a symbol, making the process easy to follow.
Flowcharts help teams see the big picture and spot areas for improvement. They also support real-time updates, so the process map stays current.
Swimlane Diagrams
Swimlane diagrams organize process steps into lanes, with each lane representing a person, team, or department. This layout shows who is responsible for each task and how work moves between groups. Swimlane diagrams make it easy to see handoffs and avoid confusion about roles.
Key Benefits of Swimlane Diagrams:
Clarify responsibilities for each task.
Improve communication by showing interactions between teams.
Identify inefficiencies like delays or unnecessary steps.
Standardize workflows to reduce uncertainty.
Foster collaboration across departments.
A practical example involves onboarding new employees. The diagram might have lanes for HR, IT, and the new hire’s manager. Each lane shows tasks like setting up accounts, providing equipment, and scheduling training. This structure ensures smooth handoffs and clear accountability.
Swimlane diagrams provide structure to complex processes. They help teams work together and feel valued, which can boost morale and productivity.
Value Stream Maps
Value stream maps (VSM) focus on the flow of materials and information through a process. These maps highlight both value-adding and non-value-adding activities. Teams use VSM to find waste, bottlenecks, and delays that slow down operations.
How Value Stream Maps Help:
Show every step in a process, from start to finish.
Pinpoint waste, such as waiting or extra movement.
Reveal bottlenecks and areas for improvement.
Encourage teamwork by making workflows visible to everyone.
Support lean initiatives and continuous improvement.
For instance, a manufacturing company might use a value stream map to track how raw materials become finished products. The map includes cycle times, wait times, and inventory levels. By seeing the entire process, the team can target the biggest sources of waste and improve efficiency.
Value stream maps give organizations a clear view of their processes. This helps them focus on the most important improvements and deliver better results for customers.
SIPOC
SIPOC stands for Suppliers, Inputs, Process, Outputs, and Customers. This type of process map gives a high-level overview of a workflow by breaking it into five key parts. Teams use SIPOC diagrams to understand who provides resources, what goes into the process, the steps involved, what comes out, and who receives the results. SIPOC mapping helps organizations see the big picture before diving into details.
A SIPOC diagram works best at the start of a project or when a team wants to improve an existing process. It helps everyone agree on what the process includes and who plays a role. SIPOC maps also make it easier to spot gaps, bottlenecks, or unnecessary steps. Many organizations use SIPOC as part of Lean and Six Sigma projects to support process improvement and quality control.
SIPOC diagrams help teams align on goals, clarify expectations, and prevent confusion. They provide a shared language for cross-functional teams.
When to Use SIPOC Mapping:
At the beginning of a project to set clear boundaries and expectations.
When improving or redesigning a process to identify pain points.
For onboarding new team members who need to understand workflows quickly.
To compare current and future processes side by side.
When editing established processes to keep them efficient and relevant.
To bridge knowledge gaps between departments and align stakeholders.
The table below shows how SIPOC mapping benefits different industries and scenarios:
Industry / Scenario | Use Case / Process Mapped | Benefits and Outcomes |
|---|---|---|
Healthcare | Patient admission process | Identified key inputs, streamlined process, reduced wait times, improved patient satisfaction. |
Education | Student enrollment process | Mapped stakeholders, optimized enrollment, improved communication, reduced administrative burden. |
Manufacturing (Automotive) | Vehicle assembly process | Pinpointed bottlenecks, optimized resources, reduced defects, improved efficiency and satisfaction. |
Manufacturing (Electronics) | Circuit board assembly | Improved supplier management, enhanced process control, reduced defects, increased reliability. |
Financial Services | Loan application process | Streamlined application, reduced turnaround time, enhanced satisfaction, better collaboration. |
Hospitality | Guest check-in/check-out processes | Optimized inputs, improved guest experience, increased satisfaction ratings. |
SIPOC diagrams provide quick diagnostics for errors and help organizations scale as processes grow more complex. For example, a restaurant facing slow delivery times used SIPOC to map out its order fulfillment process. By visualizing each step, the team found bottlenecks and improved customer satisfaction. SIPOC also supports team onboarding and helps new members learn best practices fast.
Teams that use SIPOC mapping gain a clear, shared understanding of their processes. This clarity leads to better communication, fewer mistakes, and stronger results.
Business Process Mapping Steps

Set Goals
Setting clear goals forms the foundation of any successful process mapping initiative. Teams begin by identifying what they want to achieve. These objectives might include improving efficiency, reducing costs, or enhancing customer satisfaction. Clear goals help teams stay focused and measure progress.
Define the main improvement targets, such as reducing process time or increasing accuracy.
Align goals with the organization’s overall strategy to ensure relevance.
Develop a project plan that outlines actions, timelines, and responsibilities.
Select the business system or value stream that best matches the improvement goals.
Tip: Teams should avoid mapping processes with limited impact. Focusing on high-value areas ensures that efforts lead to meaningful results.
Identify Stakeholders
Identifying stakeholders ensures that all voices are heard during the mapping process. Stakeholders include anyone who influences or is affected by the process. Teams should consider both internal and external groups.
Internal stakeholders: board members, executives, department managers, project team members, and employees.
External stakeholders: customers, end-users, suppliers, vendors, government regulators, and local communities.
Primary stakeholders: individuals or groups with direct interest and influence, such as investors, customers, and key employees.
Secondary stakeholders: those with indirect influence, including media organizations, industry analysts, and competitors.
Teams should analyze financial relationships, operational dependencies, legal obligations, and market influence when identifying stakeholders. This approach helps ensure effective engagement and increases the chances of success.
Note: Engaging the right stakeholders early leads to better collaboration and smoother implementation.
Gather Information
Accurate information gathering is essential for effective Business Process Mapping. Teams need a clear picture of the current process before making improvements.
Set specific objectives for data collection that align with business goals.
Choose data collection methods such as surveys, interviews, questionnaires, and direct observations. Each method provides unique insights.
Design data collection tools using platforms like web analytics, CRM systems, or custom applications to ensure data quality.
Pilot test tools to identify and fix any issues before full use.
Collect data ethically, respecting privacy and consent standards.
Teams should involve process users, as they are often the experts in daily operations. Gathering documents and feedback from these users helps create a complete and accurate process map. Teams should avoid making changes until they fully understand the current state.
Teams that gather thorough information can identify gaps, bottlenecks, and opportunities for improvement more effectively.
Map Process
Mapping the process turns collected information into a clear, visual workflow. Teams use this step to create a process map that everyone can understand and follow. The goal is to show each step, decision, and handoff in the process.
Best practices for mapping a process include:
Involve all stakeholders. Gather insights from people who do the work every day. Their input helps capture every important step and decision.
Define the process scope. Set clear start and end points. Decide how much detail the map should show based on its purpose.
Choose the right type of process map. Select a format that fits the process and audience, such as a flowchart, swimlane diagram, or SIPOC.
Use consistent symbols and notation. Apply standard shapes and labels so everyone can read the map easily. Many teams use ISO or BPMN symbols.
Keep it simple. Avoid adding too much detail. Focus on what the audience needs to know.
Document every step and sequence. Show the order of tasks, decisions, and relationships. Include any exceptions or special cases.
Create the map using digital tools or templates. Software like Lucidchart, Microsoft Visio, or Miro helps teams build and share maps quickly.
Review and share the draft map with stakeholders. Ask for feedback to catch missing steps or unclear areas.
Tip: Teams should break down complex processes into smaller sections. This makes the map easier to read and update.
A team mapping a customer service process might start with "Receive Customer Inquiry" and end with "Close Ticket." Each step, such as "Assign Agent" or "Resolve Issue," appears in order. Decision points, like "Is More Information Needed?" use diamond shapes. Arrows show the flow from one step to the next.
Teams often use Business Process Mapping to improve efficiency and reduce errors. For example, a manufacturing company mapped its order fulfillment process. By involving staff from sales, production, and shipping, the team found steps that caused delays. They used a swimlane diagram to show handoffs between departments. After simplifying the process, the company reduced delivery times and improved customer satisfaction.
Note: Consistent mapping practices help organizations train new employees and keep processes running smoothly.
Best Practices
Tips
Successful Business Process Mapping depends on following proven strategies. Teams that use best practices create maps that are accurate, useful, and easy to understand. The following tips help organizations get the most value from their mapping efforts:
Focus on understanding the current state before making changes. This builds trust and ensures accuracy.
Involve a balanced group of subject matter experts and stakeholders. Start with front-line staff and include management for a complete view.
Map beyond strict boundaries. Include upstream and downstream steps to capture all dependencies.
Choose the right level of detail. Avoid maps that are too simple or too complex. Aim for clarity and effective analysis.
Use industry-standard symbols and notation, such as BPMN, to make maps intuitive.
Identify and map the standard path first. Add alternative and exception paths after the main process is clear.
Analyze break-fix scenarios. This helps teams find rare but important situations that could cause problems.
Select the best layout style, like workflow or swimlane diagrams, based on process complexity.
Remember that skilled analysts are essential. Tools alone do not guarantee quality maps.
Validate the process map by walking through it in the real work environment. This step helps catch any disconnects between the map and actual practice.
Teams that follow these tips create process maps that support better decisions, smoother training, and ongoing improvement.
Pitfalls
Many organizations face challenges when mapping their processes. Avoiding common pitfalls helps teams create accurate and effective maps. The following list highlights mistakes to watch for:
Failing to gather accurate data leads to incomplete or misleading maps. Teams should collect detailed information before mapping.
Not involving all relevant stakeholders can cause teams to miss important steps or bottlenecks.
Unclear scope and purpose make it hard to know where the process starts and ends. Teams should define objectives before mapping.
Choosing the wrong format or level of detail can confuse users. Overly complex maps overwhelm, while simple maps may miss key points.
Neglecting subprocesses can leave out critical parts of the workflow.
Not updating process maps regularly results in outdated documentation that no longer reflects reality.
Poor communication and rushed mapping sessions can lead to unclear or incorrect maps. Teams should use standard symbols and logical flow.
Regular reviews and clear communication help organizations avoid these pitfalls and keep their Business Process Mapping efforts on track.
Tools and Resources
Software
Many organizations use specialized software to make process mapping easier and more effective. These tools help teams create, edit, and share visual diagrams quickly. The table below shows some of the top-rated software for process mapping, along with their features and pricing:
Software Tool | Review Rating | Pricing | Key Features & Description |
|---|---|---|---|
Creately | 4.4 / 5 | Starter plan $5/month per user | Visual workspace with no-code tools, BPMN libraries, real-time collaboration; used by Netflix, NASA, Facebook. |
Lucidchart | 4.4 / 5 | Free start; enterprise pricing | Intelligent diagramming, cloud collaboration, integrates with MS 365, Zoom, Slack; scalable for enterprises. |
MindMeister | 4.3 / 5 | Free basic; business $27.29/mo | Cloud-based mind mapping, customizable themes, integrates with popular software, includes training resources. |
Pipefy | 4.6 / 5 | Free basic; enterprise pricing | Workflow automation, low/no-code BPM tools, AI-assisted process creation and data analysis. |
ClickUp | 4.7 / 5 | Free start; business $12/user/mo | All-in-one productivity hub with task/workflow management, whiteboards for process design, drag-and-drop, extensive integrations. |
EdrawMax | 4.3 / 5 | Lifetime $245 | Diagramming and flowchart tool with AI assistance, 280 visualization types, 1600+ templates, used by Amazon, Sony, Deloitte. |
Microsoft Visio | 4.2 / 5 | From $5/user/month | Professional diagramming, templates, real-time collaboration, integrates with MS Office suite. |
GitMind | 4.8 / 5 | Free up to 10 mind maps | Collaborative mind mapping with AI features, drag-and-drop, real-time collaboration, cloud sync. |
Canva | 4.7 / 5 | Free basic; team $300/year | Drag-and-drop design software with flowchart and mind map templates, easy for non-designers, large template library. |
Cacoo | 4.4 / 5 | Free small projects; $6/user/mo | Collaboration-centric mind mapping, import spreadsheets, in-app chat/video, shared folders. |
Visme | 4.5 / 5 | Free basic; team pricing | Presentation and visual diagram creation, template-rich, collaborative, integrates with Slack, Dropbox, Google Drive. |
Notion | 4.7 / 5 | Free basic; paid $8-$15/mo | Versatile productivity tool with simple flowcharting, integrates process mapping with project management and documentation. |
Smartsheet | 4.4 / 5 | $9-$19/user/month | Work management with spreadsheet interface, workflow automation, multiple views, real-time collaboration. |
Miro | 4.8 / 5 | $0-$16/month | Collaborative online whiteboard platform for brainstorming, diagramming, and process mapping. |
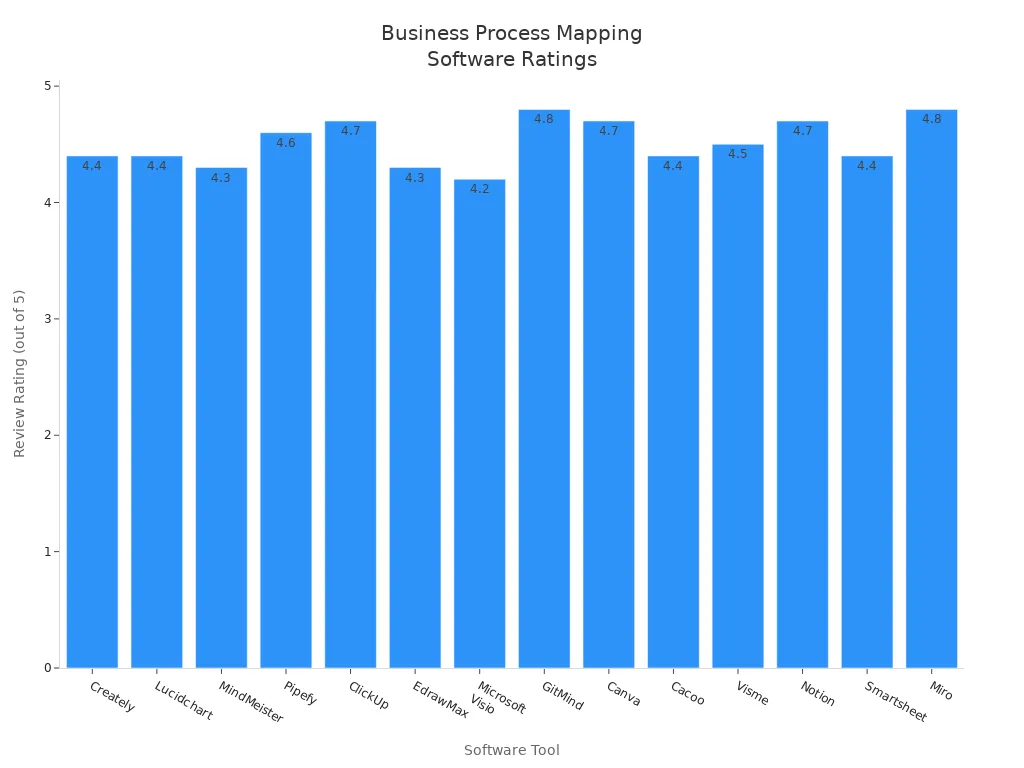
These tools offer features like real-time collaboration, drag-and-drop design, and integration with other business apps. Teams can choose software based on their needs, budget, and the complexity of their processes.
Templates
Process mapping templates help teams work faster and more consistently. Templates provide a clear structure for organizing steps, roles, and decisions. Using templates, teams can:
Gather detailed information by engaging with everyone involved in the process.
Create a high-level flowchart using standard symbols to visualize the current process.
Refine the process map with feedback from stakeholders to improve accuracy.
Analyze the map to find bottlenecks, delays, and unnecessary steps.
Implement improvements by designing a future state map and tracking key metrics.
Use collaborative online workspaces for real-time updates and alignment.
Templates also break down complex workflows into manageable parts. They clarify who does what, help spot inefficiencies, and make training easier. Teams that use templates often see better communication and faster results.
Templates make process mapping more efficient by providing a visual framework, supporting collaboration, and ensuring consistency across teams.
Training
Learning how to map business processes requires the right training resources. Many free and paid options exist for different skill levels. Some popular online platforms, such as Lucidchart, Kissflow Academy, and Skillshare, offer beginner to intermediate courses with video lessons, templates, and certificates. Paid resources like Udemy and university programs provide advanced classes and certifications in Business Process Management.
Instructor-led courses, such as the Effective Business Process Mapping course by Understanding ModernGov, give hands-on workshops and CPD certification. These sessions include interactive lessons, group discussions, and practical exercises. Many participants report that these courses build confidence and practical skills.
Free and freemium online platforms offer flexible learning with video lessons and templates.
Paid courses and certifications provide deeper knowledge and recognized credentials.
In-person or virtual workshops give interactive, tutor-led experiences.
Combining training with practical tools helps reinforce new skills.
Choosing the right training depends on experience, goals, and budget. Teams benefit most when they apply what they learn using real process mapping tools.
Business Process Mapping helps organizations achieve measurable improvements by establishing baselines, reducing costs, and enhancing quality. Teams benefit from clearer communication, better risk management, and faster production times. Regular updates and continuous learning keep processes efficient and adaptable. To maintain success, organizations should:
Practice mapping techniques and observe real workflows.
Update maps regularly and involve all stakeholders.
Foster a culture of ongoing improvement and open communication.
Continuous refinement and learning ensure that processes remain effective as organizations grow.
FAQ
What is business process mapping?
Business process mapping creates a visual diagram of how work flows in an organization. Teams use these maps to understand each step, find problems, and improve efficiency.
Who should participate in process mapping?
Teams should include people who do the work, managers, and anyone affected by the process. Involving different roles helps capture every detail and ensures the map is accurate.
How often should teams update process maps?
Teams should review and update process maps after major changes or at least once a year. Regular updates keep maps accurate and useful for training and improvement.
What tools help with business process mapping?
Many teams use software like Lucidchart, Miro, or Microsoft Visio. These tools offer templates, collaboration features, and easy sharing.
Can process mapping help small businesses?
Yes. Small businesses benefit from process mapping by finding ways to save time, reduce errors, and improve customer service. Even simple maps can make a big difference.
What is the difference between a flowchart and a swimlane diagram?
A flowchart shows steps in a process. A swimlane diagram adds lanes for each person or team, making it clear who does each task.
How does process mapping support training?
Process maps give new employees a clear guide. They show each step and who is responsible. This makes training faster and easier to understand.


