Unlocking Efficiency with Six Sigma Process Mapping
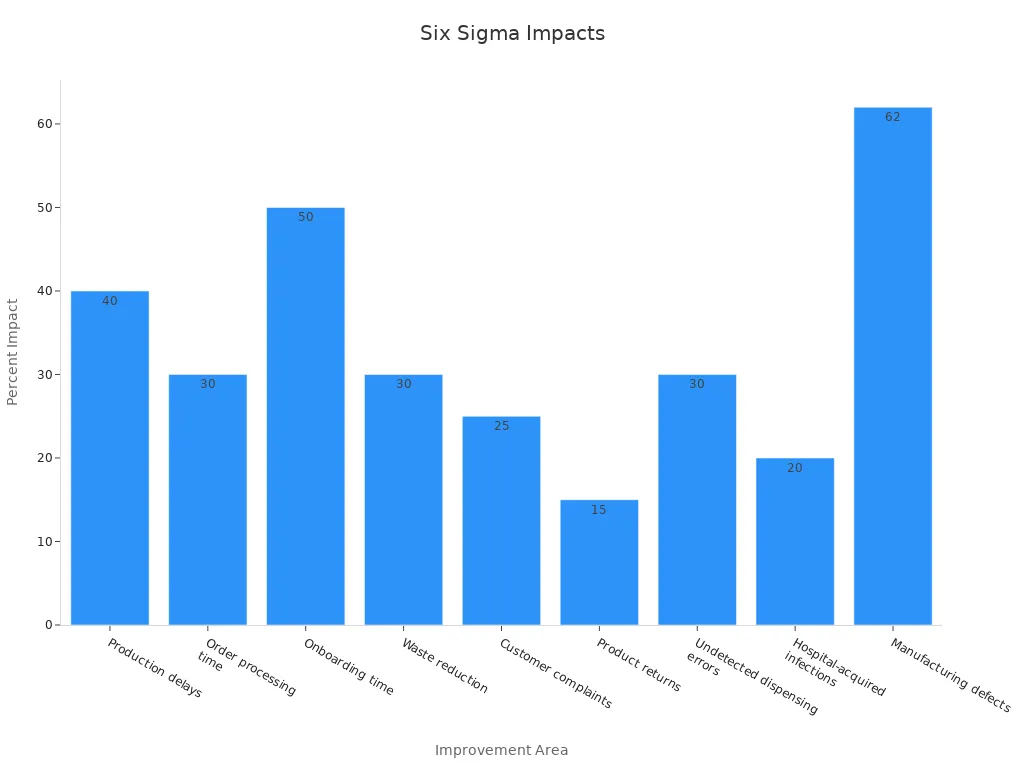
Six Sigma Process Mapping gives teams a clear view of each step in a process, making it easier to spot and remove waste. Many companies see big improvements in efficiency. For example, some report a 40% drop in production delays and a 30% reduction in waste.
Improvement Area | Quantified Impact |
|---|---|
Production delays | 40% reduction |
Order processing time | 30% reduction |
Onboarding time | 50% reduction (from 10 days to 5 days) |
Waste reduction | 30% reduction |
Cycle time improvement | 20-50% improvement |
Customers complaints | 25% reduction |
Product returns | 15% decrease |
Undetected dispensing errors | 30% reduction (healthcare example) |
Hospital-acquired infections | 20% decrease (healthcare example) |
Defect reductions | 70-90% reduction |
Manufacturing defects | 62% reduction with $10.2 million savings (GE Healthcare) |
Teams use these Optimization Steps to clarify workflows and drive continuous improvement. Many organizations encourage members to think about one process that could help both teams and customers through mapping.
Key Takeaways
Six Sigma Process Mapping helps teams visualize every step in a process, making it easier to find and fix waste and delays.
Visual tools like flowcharts, SIPOC diagrams, and swimlane maps clarify workflows and improve communication across teams.
Mapping processes leads to big efficiency gains, such as cutting production delays by 40% and reducing defects by up to 90%.
Involving all stakeholders ensures maps reflect real work and uncovers hidden problems that improve accuracy and teamwork.
Keeping process maps simple and using standard symbols helps everyone understand and use them effectively.
Regularly updating maps after changes keeps processes accurate and supports ongoing improvements.
Avoid overcomplicating maps and always act on the insights gained to drive real change and better results.
Real-world examples show that process mapping boosts productivity, cuts costs, and raises customer satisfaction across industries.
Efficiency with Process Mapping
Visual Clarity
Process mapping transforms complex workflows into clear, visual diagrams. Teams gain a unified understanding of each process step. This shared view helps everyone—from frontline workers to managers—speak the same language about how work gets done.
Graphical process maps reveal the big picture more effectively than written instructions.
Standardized notations, such as BPMN, make it easier to compare and improve processes.
Collaborative modeling tools allow teams to update and share maps in real time, improving communication.
Visual dashboards help teams track key metrics and spot patterns that might stay hidden in raw data.
Interactive maps and heatmaps highlight bottlenecks and errors, making it easier to focus improvement efforts.
Visualization supports clear communication for both technical and non-technical audiences. Real-time dashboards let teams respond quickly to issues like inventory shortages or shipping delays. This clarity leads to better decisions and faster problem-solving.
Waste Reduction
Visual process mapping helps organizations find and remove waste at every stage. By laying out each step, teams can see where time, materials, or effort get lost.
Type of VSM | Objective | Key Performance Indicators | Motivation |
|---|---|---|---|
Sustainable VSM | Visualize and evaluate environmental impact by integrating sustainability metrics | Energy use, water use, raw material use, emissions | Traditional VSM focuses on economic factors only, lacking environmental considerations |
Scrap VSM | Minimize waste and improve scrap management | Lead time, value-added time, storage costs, risk | VSM is effective for mapping and waste removal but may need adaptation for scrap management |
Energy VSM | Reduce non-value-added energy consumption | Energy consumption | To build energy-efficient machines or reduce energy use in current processes |
Empirical studies show that tools like Waste Identification Diagrams and Value Stream Mapping help teams pinpoint and measure waste. These tools reduce ambiguity and make it easier to act on improvement opportunities. In manufacturing and healthcare, waste reduction techniques built into process mapping have led to measurable cost savings and efficiency gains. Lean approaches identify and cut out defects, overproduction, and excess inventory, closing productivity gaps and improving lead times.
Productivity Boost
Clear process maps drive productivity by making it easier to spot and fix slowdowns. In manufacturing, teams have used mapping to find bottlenecks and streamline operations. Customer service organizations have mapped workflows to improve response times and centralize information, leading to better efficiency and higher satisfaction.
Organization | Location | Process Mapping Strategy | Key Productivity Improvements and Outcomes |
|---|---|---|---|
Tui Ora | New Zealand | BPM (Flowforma) | 75% improvement in productivity; 70% reduction in quality defects |
University Hospitals Birmingham NHS | UK | RPA (Blue Prism) | 50% reduction in effort; 2x faster turnaround time; improved data quality |
VTB | Russia | Process Mining (Celonis) | 30% reduction in throughput time; 4x faster application processing; improved customer satisfaction |
An intergovernmental organization used process mapping to identify risks and improvement opportunities. Through cross-functional workshops, they achieved over two dozen process improvements and saved more than $5 million annually. These results show that mapping strategies directly increase productivity and support continuous improvement.
Six Sigma Process Mapping
What Is It
Six Sigma Process Mapping is a method that uses visual diagrams to show each step in a process. These diagrams help teams see how work flows from start to finish. The main goal is to make complex processes easy to understand and improve. Teams use different types of maps, such as flowcharts, SIPOC diagrams, value stream maps, and swimlane diagrams. Each type serves a unique purpose:
Flowchart: Shows the order of steps and decisions in a process.
SIPOC Diagram: Gives a high-level view by listing Suppliers, Inputs, Process, Outputs, and Customers.
Value Stream Map: Tracks the flow of materials and information to find waste.
Swimlane Diagram: Groups steps by department or role to clarify who does what.
Teams follow a series of steps to create a process map:
Define the process scope and goals.
Gather data on each step.
Involve team members from different areas.
Draw the map using standard symbols like rectangles for steps and diamonds for decisions.
Label each step clearly.
Review and refine the map with feedback.
These maps help teams document and standardize processes. They also make training and troubleshooting easier.
Why It Matters
Six Sigma Process Mapping plays a key role in Lean Six Sigma projects. It helps teams find and remove waste, reduce errors, and improve quality. By making each step visible, teams can spot delays, bottlenecks, and unnecessary actions. This leads to better results and lower costs.
Many companies have seen big gains from using process mapping. General Electric saved over $12 billion and cut defect rates by 62%. Honeywell reduced invoice processing time by half and saved millions by cutting rework. Virginia Mason Medical Center lowered medication errors by 75%. These results show that mapping, combined with data-driven methods, leads to real improvements.
Process mapping also supports teamwork. It helps everyone understand the process and agree on what needs to change. Teams can use maps to set clear goals, measure progress, and keep improvements going over time.
Company | Challenge | Solution Implemented | Results Achieved |
|---|---|---|---|
General Electric | High defect rates | DMAIC process improvement | Near-zero defect rates; major cost savings |
Motorola | Frequent process errors | Lean Six Sigma integration | Better product quality; fewer complaints |
Toyota | Overproduction, excess inventory | 5S and VSM methodologies | Streamlined operations; less waste and shorter lead times |
Process mapping gives teams the tools to see problems clearly and fix them for good.
Role in DMAIC
DMAIC stands for Define, Measure, Analyze, Improve, and Control. It is the main method used in Six Sigma projects. Six Sigma Process Mapping is most important in the Define phase. Here, teams use maps to outline the current process, set project goals, and understand customer needs.
Key tools in the Define phase include SIPOC diagrams, flowcharts, and swimlane charts. These tools help teams see the big picture and focus on what matters most. For example, a SIPOC diagram shows all the key parts of a process, from suppliers to customers. Flowcharts and swimlane diagrams show the order of steps and who is responsible for each one.
DMAIC Phase | Description | Role of Process Mapping |
|---|---|---|
Define | Set problem, goals, scope, and customer needs | Visualize current process to start analysis |
Measure | Check current performance | Find key inputs, outputs, and areas with variation |
Analyze | Find root causes of problems | Highlight bottlenecks and extra steps |
Improve | Test and put solutions in place | Show changes and compare new process to old |
Control | Keep improvements going | Update maps to reflect new standard process |
Teams use process maps to keep everyone on the same page. These maps guide the project from start to finish and help make sure improvements last.
Process Map Types

Flowcharts
Flowcharts provide a simple way to show the steps in a process. Each step appears as a box, and arrows connect the boxes to show the order. People use flowcharts when they want to document a process with clear, sequential steps. For example, a company might use a flowchart to show how to handle a customer return. The chart starts with the customer request, moves to product inspection, and ends with a refund or replacement.
Flowcharts work well because they are easy to read and understand. Teams can quickly spot where a process might slow down or where mistakes could happen. In many organizations, flowcharts help train new employees or explain changes to a process. They also support quick communication between departments.
Tip: Use flowcharts for processes that follow a clear path from start to finish. They help teams see the big picture and find places to improve.
SIPOC
SIPOC stands for Suppliers, Inputs, Process, Outputs, and Customers. This type of map gives a high-level view of a process. Teams use SIPOC diagrams at the start of a project to understand all the important parts. SIPOC helps identify who provides inputs, what those inputs are, the main steps in the process, what comes out at the end, and who receives the outputs.
Professional case studies show that SIPOC diagrams work best in complex projects. For example, a hospital used SIPOC to map patient admissions. The team identified key inputs and found bottlenecks, which led to shorter wait times and happier patients. A university used SIPOC to review student enrollment. The diagram helped clarify who was involved and what steps needed improvement, making the process smoother for students and staff.
SIPOC diagrams help teams and stakeholders agree on what the process includes. They also make it easier to spot missing steps or unclear roles before moving to detailed mapping.
Value Stream Map
A value stream map shows how materials and information move through a process. This map highlights every step, from the start to the finish, and points out where waste or delays happen. Teams use value stream maps to find and remove steps that do not add value.
Value stream maps work well in manufacturing, supply chain, and service delivery. For example, a company might use this map to track how a product moves from raw materials to the customer. The map shows where time is lost or where extra inventory builds up. By seeing the whole process, teams can focus on cutting waste and making the process faster.
Note: Value stream maps help teams see the entire process, not just one part. They support lean improvements by showing where to act first.
Process Map Type | When to Use | Why It Works | Example Use Cases |
|---|---|---|---|
SIPOC | For identifying and analyzing inputs/outputs at a high level; useful to brainstorm process elements before detailed mapping | Collaborative approach enhances stakeholder communication; helps gather comprehensive process info early | Customer service, order fulfillment, financial reporting, product development |
Flowchart | For relatively simple or high-level process documentation with clear sequential steps | Intuitive and easy to understand; quickly communicates process flow | Purchase requisition, customer returns, content review and approval |
Value Stream Map | When aiming to identify and eliminate waste or inefficiencies in processes | Visualizes entire value stream; highlights waste and delays; supports lean improvements | Supply chain, prototyping, product/service delivery |
These three process map types each serve a unique purpose. Flowcharts clarify step-by-step actions. SIPOC diagrams give a broad overview and help teams align early. Value stream maps reveal waste and guide lean improvements.
Swimlane Diagram
A swimlane diagram shows how different people or departments work together in a process. Each "lane" represents a group, such as sales, customer service, or shipping. The diagram places steps in the correct lane to show who does what. This makes it easy to see handoffs and responsibilities.
Teams often use swimlane diagrams when a process crosses several departments. For example, in order fulfillment, the sales team takes the order, the warehouse packs the items, and shipping delivers them. Each group has its own lane. The diagram helps teams spot delays or confusion when work moves from one group to another.
Swimlane diagrams help teams find gaps, overlaps, or unclear roles in a process. They also make it easier to train new staff and explain complex workflows.
When to use swimlane diagrams:
Processes with many departments or roles
Projects with frequent handoffs
Workflows that need clear responsibility
Why use them:
Swimlane diagrams improve communication. They help teams avoid missed steps and reduce errors. Many organizations use them to redesign processes and make sure everyone knows their tasks.
End-to-End Map
An end-to-end map gives a full view of a process from the first step to the last. This type of map shows every action, decision, and outcome. It helps teams understand how work flows across the entire organization.
End-to-end maps work best for large or complex processes. For example, a company might use this map to track a product from design to delivery. The map shows how each department connects to the next. Teams can see where delays or waste happen.
Feature | Benefit |
|---|---|
Full process overview | Reveals hidden bottlenecks |
Cross-department view | Improves teamwork |
Step-by-step detail | Supports root cause analysis |
Note: End-to-end maps help teams find weak spots and plan big improvements. They also support audits and compliance checks.
TMAP
TMAP stands for "Time Mapping Analysis Process." This tool focuses on the time each step in a process takes. Teams use TMAP to spot slow steps and reduce waiting times.
A TMAP often looks like a timeline. Each step appears with its start and end time. Teams can see which steps take the longest and where work piles up. For example, a hospital might use TMAP to track patient flow from check-in to discharge. The map shows where patients wait the most.
Key uses for TMAP:
Finding bottlenecks in long processes
Reducing cycle time
Improving service speed
Why choose TMAP:
TMAP helps teams make data-driven decisions. By focusing on time, teams can set goals to speed up the process. Many organizations use TMAP with other mapping tools to get a complete picture.
Tip: Combine TMAP with swimlane or end-to-end maps for deeper insights.
Process Mapping Steps
Define Scope
Defining the scope sets the foundation for successful process mapping. Teams start by deciding what process to map, where it begins, and where it ends. Clear boundaries help everyone focus on the same goals and avoid confusion. Setting the scope also means choosing what to include and what to leave out. This step prevents wasted effort and keeps the project on track.
A well-defined scope answers these questions:
What is the purpose of mapping this process?
Where does the process start and finish?
What are the main goals, such as reducing delays or improving teamwork?
Teams often write a short statement that describes the process, its start and end points, and the expected outcomes. This statement guides all later steps and helps measure success.
Tip: A clear scope keeps the team focused and makes it easier to spot improvements.
Identify Steps
After setting the scope, teams list every step in the process. This includes tasks, decisions, handoffs, and manual actions. Involving people who do the work ensures the map matches reality. Teams gather information through interviews, observations, and reviewing documents. This approach helps capture every detail, including sub-processes and exceptions.
Comprehensive data gathering leads to better results. For example, in software development, using flowcharts with input from all team members led to a 30% reduction in bug fix deployment time. In manufacturing, value stream maps increased production efficiency by 15%. In corporate banking, swimlane maps cut loan approval times by 40%. These improvements show the value of involving everyone and collecting detailed data.
Process Mapping Type | Context/Industry | Quantitative Improvement |
|---|---|---|
Flowchart | Software development | 30% reduction in bug fix deployment time |
Value Stream Map | Manufacturing | 15% increase in production efficiency |
Swimlane Maps | Corporate banking | 40% decrease in loan approval processing time |
Teams should list all activities, tasks, and decisions. They should also note who is responsible for each step. This level of detail helps avoid missing critical actions and supports accurate mapping.
Sequence Activities
Sequencing activities means arranging the identified steps in the correct order. Teams look at how tasks flow from one to the next. They use tools like sticky notes, whiteboards, or digital mapping software to organize steps. Logical sequencing reveals dependencies, bottlenecks, and repeated work.
In manufacturing, grouping features and analyzing tool directions help optimize the number of setups and improve efficiency. For example, teams may group similar tasks together to reduce changeover time. They also use sequencing to spot delays and unnecessary steps.
A typical sequence for Six Sigma Process Mapping looks like this:
Identify and involve key stakeholders.
Gather data on every step, decision, and handoff.
Arrange steps in a logical, chronological order.
Use diagrams to visualize the sequence and highlight problem areas.
Validate the sequence with team members to ensure accuracy.
Sequencing activities uncovers hidden problems and helps teams design smoother, more efficient processes.
Visual Representation
Teams turn process steps into visual diagrams during this stage. They use tools like flowcharts, SIPOC diagrams, value stream maps, and swimlane diagrams. Each tool helps teams see the process from a different angle. For example, a flowchart shows the order of steps, while a swimlane diagram highlights who does each task.
To create a clear visual map, teams follow these steps:
Choose the right mapping tool for the process.
Use standard symbols, such as rectangles for actions and diamonds for decisions.
Draw each step in the correct order.
Connect steps with arrows to show the flow.
Label each step with simple, clear words.
Tip: Teams should keep diagrams simple. Too many details can make maps hard to read.
Teams often use digital tools like Lucidchart, Microsoft Visio, or Miro. These tools let teams edit maps together and share them easily. Some teams use sticky notes on a whiteboard for quick drafts. Digital maps work best for large projects or remote teams.
A good visual map helps everyone understand the process. It shows where work slows down or repeats. Teams can spot extra steps or missing actions. Visual maps also help new team members learn the process faster.
Symbol | Meaning | Example Use |
|---|---|---|
Rectangle | Process step | "Check inventory" |
Diamond | Decision point | "Is payment received?" |
Arrow | Flow direction | Shows next step |
Oval | Start or end | "Begin order" or "Finish" |
Note: Teams should use the same symbols every time. This makes maps easier to read and compare.
Review and Validate
After creating the visual map, teams review it with everyone involved in the process. This step checks for mistakes, missing steps, or unclear actions. Team members walk through the map together. They ask questions and suggest changes.
A review session often includes:
People who do the work every day
Managers or supervisors
Stakeholders from other departments
Teams look for these common issues:
Steps that do not match real work
Missing handoffs or decisions
Unclear labels or symbols
Extra steps that add no value
Teams should listen to feedback from everyone. People who do the work often spot problems that others miss.
Teams update the map based on feedback. They repeat the review if needed. A validated map becomes the standard for the process. Teams use it to train others, measure performance, and plan improvements.
A checklist for review and validation:
All steps included and in the right order
Clear labels and standard symbols
Correct handoffs and responsibilities
Feedback from all key team members
Final approval from process owner
A well-reviewed map builds trust. It shows that the team values accuracy and teamwork.
Best Practices
Stakeholder Engagement
Successful process mapping starts with strong stakeholder engagement. Teams involve everyone who touches the process, from frontline workers to managers. This approach ensures the map reflects real work, not just theory. When teams invite stakeholders to workshops or mapping sessions, they gather valuable insights and spot hidden issues.
Teams use standardized symbols so everyone speaks the same visual language.
Stakeholders help validate maps, which builds trust and ensures accuracy.
Swimlane diagrams assign clear roles, making it easy to see who does what.
Open discussions encourage feedback and highlight areas for improvement.
Teams keep documentation accurate by involving all parties in updates.
Involving stakeholders early leads to better collaboration and fewer misunderstandings. When everyone agrees on the process, teams can move forward with confidence.
Standard Symbols
Standard symbols make process maps easy to read and understand. Teams use rectangles for tasks, diamonds for decisions, and arrows for flow. This consistency helps everyone, even new team members, follow the process without confusion.
Consistent symbols create a shared visual language across departments.
Flowcharts and swimlane diagrams simplify complex ideas and clarify responsibilities.
Visual maps highlight bottlenecks and redundant steps, making it easier to spot problems.
Teams use these maps as training tools, helping new employees learn faster.
Standard symbols also support better communication. When everyone uses the same icons, teams avoid misinterpretation. This practice leads to smoother handoffs and greater accountability. Visual consistency helps teams compare different processes and track improvements over time.
Simplicity
Simplicity is key to effective process mapping. Teams should avoid clutter and focus on the main steps. Simple maps are easier to update, share, and use for training. When teams keep maps clear, they help everyone understand the process quickly.
Use short labels and clear symbols.
Limit the number of steps on each map.
Remove unnecessary details that do not add value.
Simple process maps reveal the most important information. They help teams find and fix problems faster.
Clear and simple maps also support continuous improvement. Teams can spot changes in workflow, update maps easily, and keep everyone informed. Regular reviews ensure that maps stay accurate as processes evolve.
Regular Updates
Regular updates keep process maps accurate and useful. Teams often change how they work. New technology, staff changes, or new regulations can affect a process. If teams do not update their maps, the maps become outdated and less helpful.
Teams should set a schedule for reviewing process maps. Many organizations review maps every six months or after a major change. Regular reviews help teams catch errors, spot new bottlenecks, and remove steps that no longer add value. When teams update maps, they also keep training materials current.
A simple checklist helps teams decide when to update a process map:
A new tool or software enters the workflow.
A team member changes roles or leaves.
A new regulation or policy affects the process.
Teams notice repeated mistakes or delays.
Customers give feedback about problems.
Tip: Teams should not wait for a big problem before updating a map. Small, regular updates prevent bigger issues later.
Teams can use digital tools to make updates easier. Software like Lucidchart or Microsoft Visio allows quick edits and sharing. Cloud-based tools let everyone see the latest version. Teams can also track changes and keep a history of updates.
When teams update a process map, they should involve people who use the process every day. These team members know what works and what does not. Their feedback helps keep the map accurate. Teams should also ask for input from managers and other departments. This approach ensures the map reflects the real workflow.
A table can help teams organize their update process:
Update Trigger | Action Needed | Who Should Review |
|---|---|---|
New software installed | Revise affected steps | IT, process users |
Staff change | Update responsibilities | HR, team leads |
Policy change | Add or change steps | Compliance, managers |
Customer complaint | Review for errors | Customer service, QA |
Regular updates support continuous improvement. Teams can measure progress and see if changes lead to better results. Updated maps also help new employees learn faster. They reduce confusion and support better teamwork.
Note: Keeping process maps current shows a commitment to quality and efficiency. Teams that update maps regularly find it easier to adapt to change and maintain high performance.
Common Pitfalls
Overcomplication
Many teams fall into the trap of making process maps too complex. They add too many details, symbols, or steps, which can overwhelm users and hide the most important information. A clear and simple map helps everyone understand the process and spot areas for improvement. When teams include unnecessary information, they risk confusing stakeholders and reducing the map’s usefulness.
One study found that about 70% of organizations do not set clear objectives for their journey maps. This lack of direction often leads to cluttered and ineffective outcomes. Another 68% collect data but fail to use it effectively, which adds to the complexity and makes the process harder to manage. Teams should focus on value-added activities and lead times, leaving out irrelevant details.
Overcomplicated maps slow down decision-making.
Stakeholders may lose interest if they cannot follow the map.
Simple maps support better training and faster improvements.
Tip: Teams should always ask, “Does this detail help us reach our goal?” If not, it may be best to leave it out.
Ignoring Input
Ignoring input from key people is another common pitfall. Teams sometimes build maps based only on their own views, missing important insights from others who work in or with the process. About 75% of companies focus too much on internal perspectives and overlook the actual customer experience. This approach can lead to maps that do not reflect reality and fail to solve real problems.
Lack of cross-functional collaboration limits diverse insights.
Internal bias can skew the map, making it less accurate.
Teams may miss hidden steps or pain points without broad input.
For example, if a team relies only on customer surveys, they might miss parts of the journey and make poor decisions. Combining feedback from interviews, surveys, and analytics gives a more complete picture. Teams should invite people from different departments and roles to share their experiences and ideas.
Note: Collaboration across departments leads to more accurate and actionable process maps.
Lack of Action
Creating a process map is only the first step. Some teams stop after mapping and never use the results to drive change. This lack of follow-through means the organization misses out on the benefits of process mapping. Ineffective outcomes often stem from not acting on the insights gained.
Teams may spend time mapping but fail to implement improvements.
Without action, problems remain unsolved and processes stay inefficient.
Regular reviews and updates help ensure that maps lead to real change.
A process map should guide teams to test solutions, measure results, and make ongoing improvements. Teams that act on their findings see better performance and higher satisfaction among both employees and customers.
Teams should treat process mapping as a tool for continuous improvement, not just a one-time exercise.
Data Gaps
Data gaps often cause major problems in process mapping. Teams sometimes miss important information when they collect data. Missing data can lead to incomplete maps and wrong decisions. When teams do not have all the facts, they may overlook key steps or misunderstand how a process works.
Many organizations struggle with data collection. They may rely on outdated reports or incomplete records. Sometimes, teams skip direct observation and only use secondhand information. This approach increases the risk of missing steps or errors.
Common sources of data gaps include:
Incomplete documentation of current processes
Lack of real-time data or recent updates
Missing input from frontline workers
Overreliance on assumptions instead of facts
Teams should always check if their data covers every step and decision point. Missing even one step can hide a major problem.
A table can help teams track where data gaps might appear:
Data Source | Risk of Gaps | Example Problem |
|---|---|---|
Process documents | High | Outdated steps not removed |
Interviews | Medium | Staff forget rare exceptions |
Observations | Low | Missed steps if not thorough |
System logs | Medium | Automated steps not recorded |
Teams can use several strategies to close data gaps:
Cross-check multiple sources: Compare documents, interviews, and observations to find missing details.
Involve frontline staff: Workers who do the job every day often know about steps that others miss.
Update data regularly: Processes change over time. Teams should review and refresh their data often.
Use direct observation: Watching the process in action helps teams see what really happens.
Tip: Teams should create a checklist to make sure they collect data from all possible sources.
Data gaps can lead to poor process maps. These maps may miss bottlenecks, skip important handoffs, or ignore exceptions. As a result, teams may fix the wrong problems or fail to improve the process.
Teams that address data gaps build more accurate and useful maps. They can spot real issues and make better decisions. Reliable data supports continuous improvement and helps organizations reach their goals.
Real-World Example
Case Overview
A leading aerospace parts manufacturer faced long machining cycle times and inconsistent product quality. The company noticed that production delays and high process variation affected both profitability and customer satisfaction. Leaders wanted to improve efficiency and reduce waste without making large investments in new technology. They decided to use process mapping to analyze and improve their workflow.
Other organizations have faced similar challenges. For example, Catalent Pharma Solutions improved batch maintenance and reduced defects in pharmaceutical production. Baxter Manufacturing doubled revenue and saved water by reducing waste. The Texas Department of Licensing and Regulation streamlined records management, cutting storage costs and building a stronger department. These examples show that process mapping can help many industries solve operational problems.
Organization | Application Area | Measurable Results and Improvements |
|---|---|---|
Aerospace Parts Manufacturer | Machining cycle time | 46% reduction in cycle time; 80% decrease in process variation; increased productivity and profitability. |
Catalent Pharma Solutions | Pharmaceutical production | Reduced defect rates; improved batch maintenance; cost reduction. |
Baxter Manufacturing | Environmental performance | Reduced waste; doubled revenue; significant water and cost savings. |
Texas Department of Licensing and Regulation (TDLR) | Records management | Reduced storage costs; streamlined processes; robust records management. |
Ford Motors | Automotive manufacturing | $2.19 billion waste reduction; $1 billion cost savings; 5-point increase in customer satisfaction. |
Mapping Approach
The aerospace manufacturer formed a cross-functional team to map the entire machining process. Team members included operators, engineers, and supervisors. They started by defining the process scope, focusing on the steps from raw material entry to finished part inspection. The team used flowcharts and swimlane diagrams to visualize each step and identify who was responsible.
During mapping sessions, the team gathered data from machine logs, direct observations, and staff interviews. They discovered that 70% of defects came from one specific machine. The process map highlighted bottlenecks, unnecessary handoffs, and areas with repeated errors. The team used this information to redesign the workflow, replace the faulty machine, and standardize best practices.
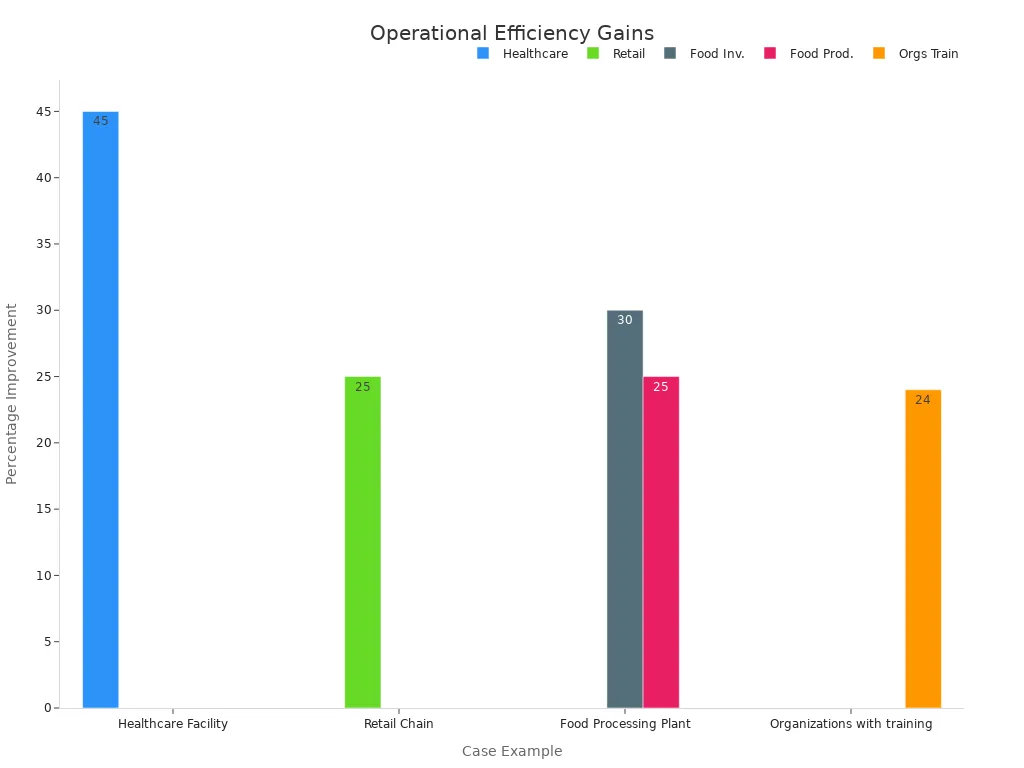
In other industries, similar mapping approaches have revealed hidden inefficiencies. For example, process mapping in healthcare facilities reduced patient discharge times by 45%. Retail chains and food processing plants also saw major improvements in inventory management and production speed.
Results
After implementing the new process, the aerospace manufacturer achieved a 46% reduction in machining cycle time and an 80% decrease in process variation. Productivity and profitability increased, and customer satisfaction improved. The company did not need major new investments, showing that process mapping alone can drive significant change.
Other organizations have reported similar gains. Ford Motors saved $1 billion in costs and reduced waste by $2.19 billion. Healthcare facilities cut patient discharge times by nearly half. Food processing plants increased production speed by 25% and reduced inventory costs by 30%. These results show that process mapping leads to measurable improvements across many sectors.
Process mapping gives teams a clear view of their workflow, helping them find and fix problems quickly. This approach supports continuous improvement and delivers real, measurable results.
Process mapping delivers clear benefits for teams aiming to boost efficiency and drive continuous improvement:
Teams identify and remove non-value-added activities, reducing waste and bottlenecks.
Visualization tools clarify complex workflows, making roles and gaps easy to spot.
Collaboration and transparency improve, leading to better communication and accountability.
Data-driven insights help teams set goals and monitor progress.
Starting with a simple flowchart often uncovers up to 80% of workflow problems. Teams can sketch basic steps, then build on this foundation with more detailed tools as needed. This approach helps any organization experience quick wins and lasting improvements.
FAQ
What is the main goal of Six Sigma process mapping?
Six Sigma process mapping helps teams see every step in a process. This clear view allows them to find waste, reduce errors, and improve efficiency.
How often should teams update process maps?
Teams should review process maps after any major change or at least every six months. Regular updates keep maps accurate and useful for everyone.
Which process map works best for complex workflows?
Swimlane diagrams work well for complex workflows. They show how different teams or departments handle each step. This makes roles and handoffs clear.
Can process mapping help small businesses?
Yes. Small businesses can use process mapping to improve daily tasks, reduce mistakes, and save time. Even simple maps can reveal big opportunities for improvement.
What tools do teams use to create process maps?
Teams often use digital tools like Lucidchart, Microsoft Visio, or Miro. Some teams start with sticky notes or whiteboards for quick drafts.
How does process mapping support continuous improvement?
Process mapping gives teams a visual guide. They can spot problems, test solutions, and track progress. This cycle supports ongoing improvement and better results.
What symbols appear most often in process maps?
Symbol | Meaning |
|---|---|
Rectangle | Process step |
Diamond | Decision point |
Arrow | Flow direction |
Oval | Start or end |
These symbols help everyone read and understand the map quickly.


