How to Master Lean Six Sigma Process Mapping in 2026

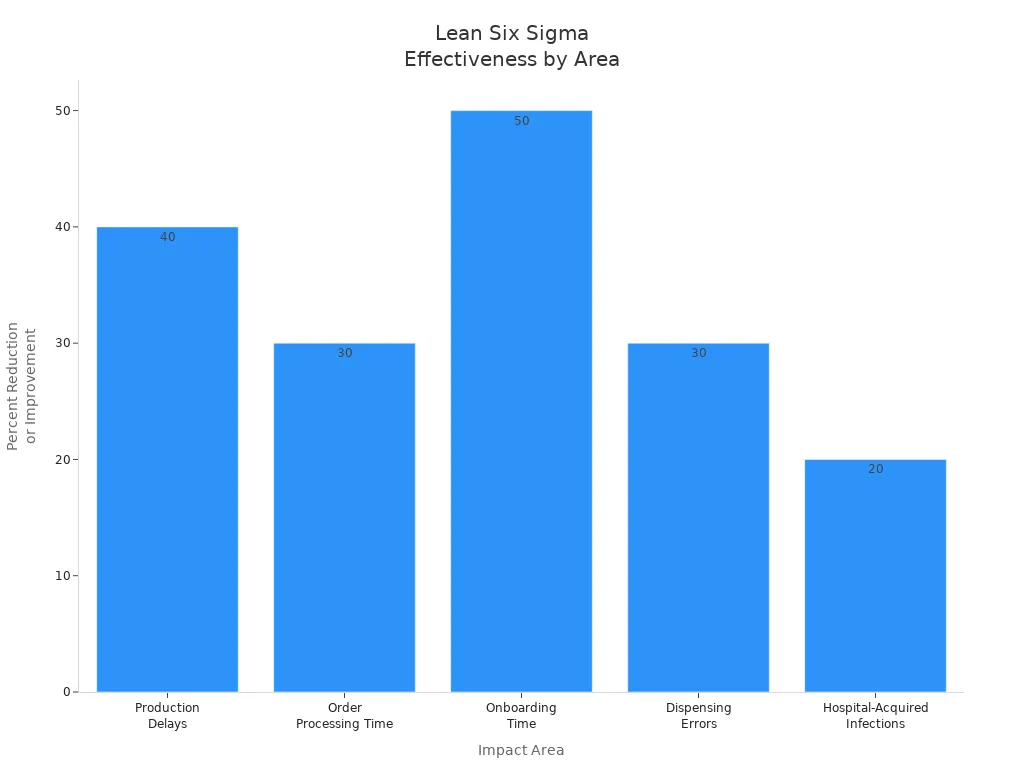
Mastering Lean Six Sigma Process Mapping starts with a clear roadmap. Teams first identify non-value steps, then prioritize improvements and develop action plans that align with business goals. They define boundaries and involve stakeholders, ensuring the process reflects real needs. This method reduces waste, improves efficiency, and supports data-driven decisions for both clients and customers. Many organizations now see measurable results, such as a 40% drop in production delays and a 30% decrease in healthcare errors.
Impact Area | Measurable Outcome / Example |
|---|---|
Production Delays | 40% reduction in supply chain delays |
Order Processing Time | 30% reduction through automation |
Onboarding Time | Reduced from 10 days to 5 days |
Dispensing Errors | 30% reduction in healthcare errors |
Hospital-Acquired Infections | 20% decrease in healthcare settings |
Teams who use Lean Six Sigma Process Mapping gain visual clarity, making it easier to spot issues and sustain improvements. Continuous learning and the right resources help organizations build a culture of ongoing success.
Key Takeaways
Lean Six Sigma Process Mapping helps teams visualize processes, making it easier to identify inefficiencies and areas for improvement.
Defining clear boundaries and goals is crucial for effective process mapping. This focus keeps teams aligned and on track.
Involving stakeholders early in the mapping process ensures the final product meets real needs and increases buy-in.
Regularly measuring performance allows teams to establish baselines and track improvements over time.
Using tools like SIPOC diagrams and swimlane diagrams enhances communication and clarifies responsibilities among team members.
Continuous improvement is key. Teams should focus on small, incremental changes to sustain long-term results.
Standardizing processes locks in gains and minimizes errors, helping teams maintain high-quality outcomes.
Training and embedding process mapping into the organizational culture fosters accountability and encourages ongoing learning.
Lean Six Sigma Process Mapping Overview

What Is Process Mapping
Process mapping shows each step in a business process using a visual diagram. Teams use this tool to clarify how work flows from start to finish. Within Lean Six Sigma Process Mapping, the diagram helps teams see every action, decision, and handoff. This graphical representation makes it easier to spot areas that need improvement. Teams can define the process clearly, which helps them eliminate defects and streamline operations. Process mapping acts as a roadmap, guiding teams through complex tasks and supporting Lean Six Sigma goals.
Why Process Mapping Matters
Lean Six Sigma Process Mapping uncovers inefficiencies and waste in business operations. Teams use the map to find steps that do not add value. By removing these steps, organizations reduce costs and improve speed. The process map also supports continuous improvement. Teams can revisit the map to check for new problems or opportunities. Process mapping improves communication among team members. It creates a shared understanding of workflows, which helps everyone stay on the same page. The map simplifies complex operations and reduces misunderstandings. Increased transparency promotes accountability and helps teams sustain improvements. Many organizations report higher productivity and fewer delays after using process mapping.
Teams who use process mapping often see faster delivery times and fewer errors. The map helps them work together and solve problems quickly.
Key Benefits
Benefit Type | Description |
|---|---|
Operational Efficiency | Cost reductions through waste elimination and streamlined workflows. |
Improved Quality and Reliability | Consistent quality delivery by reducing process variation and minimizing defects. |
Enhanced Customer Satisfaction | Higher quality and faster delivery times lead to stronger customer loyalty and retention. |
Promoting Innovation and Excellence | Fosters a culture of continuous improvement and empowers employees to innovate. |
Defect Prevention | Mitigates errors early in the process, minimizing costly rework. |
Waste Reduction | Streamlines operations by eliminating non-value-added activities, enhancing productivity. |
Cycle Time Improvement | Accelerates process throughput, achieving faster delivery times. |
Cost Efficiency | Lowers operational expenses by optimizing resource utilization. |
Increased Customer Satisfaction | Ensures high-quality, timely delivery, fostering trust and loyalty. |
Process mapping creates a shared understanding of workflows, enhancing communication among team members.
It simplifies complex operations, ensuring consistent interpretation and reducing misunderstandings.
Increased transparency promotes accountability, which is essential for reducing errors and sustaining improvements.
Organizations report increased productivity and reduced delays due to improved communication and collaboration.
Manufacturing companies have reduced cycle times and minimized material waste by identifying redundant steps through process mapping.
Service industries have streamlined operations and enhanced customer satisfaction using process mapping.
Core Steps in Lean Six Sigma Process Mapping
Define the Process
Defining the process sets the foundation for every Lean Six Sigma Process Mapping project. Teams start by clarifying what they want to improve and why the process matters. They use visual tools to outline the process from start to finish. This step ensures everyone understands the project’s purpose and scope.
Set Boundaries and Goals
Teams must set clear boundaries and goals before mapping begins. Boundaries define where the process starts and ends. Goals describe what the team wants to achieve, such as reducing errors or speeding up delivery. Teams often use a SIPOC diagram to capture the process at a high level. This diagram shows Suppliers, Inputs, Process, Outputs, and Customers. Setting boundaries and goals helps teams stay focused and measure progress.
Description | |
|---|---|
Improvement objectives | Must be clear and continuous. |
Step 1: Select the process | Identify the reason for creating the process map and define the beginning and end goals. |
Step 2: Identify the Scope | Observe the entire process, document it, and identify all parameters involved. |
Step 3: Plan and Schedule Resources | Identify systems involved and focus on roles rather than jobs. |
Tip: Teams should review previous documentation and choose the right mapping technique for their project.
Identify Stakeholders
Stakeholders include anyone who uses, manages, or is affected by the process. Teams identify these people early to ensure the process map reflects real needs. Stakeholder analysis and the voice of the customer matrix help teams gather feedback and set priorities. Involving stakeholders from the start increases buy-in and leads to better results.
Measure Performance
After defining the process, teams measure how well it works. This step involves collecting data and establishing a baseline for current performance. Accurate measurement helps teams focus on the most important issues.
Gather Data
Teams collect both discrete and continuous data to understand the process. Discrete data includes counts, such as the number of customer complaints. Continuous data includes measurements, such as cycle time or distance.
Type of Data | Description |
|---|---|
Discrete data | Data that consists of integers or counts, such as the number of customer complaints or weekly defects. |
Continuous data | Data that can take any value within a range, such as stack height, distance, or cycle time. |
Teams use data collection plans and detailed process maps to organize information. They may also use value stream maps to visualize the flow of materials and information.
Establish Baselines
Establishing a baseline means recording how the process performs before making changes. Teams use descriptive statistics to summarize data, such as averages and ranges. They may also use advanced statistics, process capability analysis, and statistical process control to understand variation and identify trends.
Method | Description |
|---|---|
Descriptive Statistics | Summarizes data using measures of central tendency and dispersion, providing a baseline understanding of process performance. |
Advanced Statistics | Includes techniques like ANOVA, Correlation Analysis, and Design of Experiments to identify significant factors and relationships. |
Process Capability Analysis | Assesses if a process meets specified requirements and quantifies its capability using metrics like Cp and Cpk. |
Statistical Process Control | Utilizes control charts to monitor process behavior over time, distinguishing between normal and special cause variation. |
Note: Accurate baselines help teams measure the impact of improvements later in the project.
Analyze Inefficiencies
Once teams have measured performance, they analyze the process to find inefficiencies. This step helps teams understand what causes problems and where to focus improvement efforts.
Find Bottlenecks
Teams look for steps that slow down the process or create delays. Common inefficiencies include:
Lack of understanding of the methodology
Insufficient resources
Teams use process mapping and data analysis to spot these issues. They may also review the process map for redundant steps or unnecessary handoffs.
Root Cause Analysis
Root cause analysis helps teams understand why problems occur. Several analytical techniques support this step:
Technique | Description |
|---|---|
Data Analysis | Examine data to identify patterns, trends, and outliers. |
Process Mapping | Create flowcharts to visualize processes and identify inefficiencies. |
Root Cause Analysis | Use tools like Fishbone Diagrams and the 5 Whys technique to identify underlying causes. |
Hypothesis Testing | Formulate and test hypotheses to validate potential root causes. |
Fishbone Diagram | A visual tool to systematically identify potential root causes categorized by significant categories. |
5 Whys Technique | A method of asking “why” repeatedly to uncover deeper insights into the root cause. |
Pareto Analysis | A statistical technique to identify the most significant factors contributing to a problem. |
Regression Analysis | A statistical method to understand relationships between variables and identify potential causes. |
Teams often use the Fishbone Diagram and 5 Whys Technique to dig deeper into problems. These tools help teams move beyond symptoms and address the real causes of inefficiency.
Teams who follow these steps in Lean Six Sigma Process Mapping build a strong foundation for lasting improvements.
Improve the Process
After teams analyze inefficiencies, they move to the improvement phase. This stage focuses on implementing solutions and testing changes to ensure lasting results.
Implement Solutions
Teams select solutions based on root cause analysis and data findings. They prioritize actions that address the most significant issues. Continuous improvement forms the core of Lean Six Sigma Process Mapping. Teams make small, incremental changes that build over time. Stakeholder involvement remains essential during this phase. Teams gather input from those affected by the process to ensure solutions fit real needs. Effective mapping techniques, such as SIPOC diagrams, provide a high-level overview before teams dive into detailed improvements.
Best practices for implementing process improvements:
Teams focus on ongoing enhancements through small, incremental changes.
Stakeholders participate during mapping and improvement activities.
Teams use SIPOC diagrams to gain a broad understanding before detailed analysis.
Teams who involve stakeholders and use structured mapping techniques achieve more comprehensive improvements.
Test Changes
Testing changes helps teams confirm that solutions work before full-scale implementation. Teams use pilot tests, simulations, or controlled trials to evaluate the impact of new methods. They collect data and compare results to baseline measurements. This approach reduces risk and prevents costly mistakes.
Phase | Description |
|---|---|
T1 | Preclinical and animal testing shifted to human subjects |
T2 | Initial testing results in human subjects migrate to patients |
T3 | Implementation and dissemination of research discoveries into accepted clinical practice |
Teams in manufacturing use hypothesis testing to assess new production techniques. Logistics teams test delivery route changes to measure cost reductions. Airlines evaluate boarding procedure adjustments to improve punctuality.
A manufacturing company uses hypothesis testing to assess the impact of a new production technique on defect rates.
A logistics company tests a hypothesis about delivery routes to quantify transportation cost reductions.
An airline evaluates changes in boarding procedures to determine their effect on punctuality.
Testing changes before full-scale rollout helps teams avoid errors and ensures improvements deliver measurable benefits.
Control and Sustain
Once teams implement and test improvements, they focus on controlling and sustaining results. This phase ensures that gains remain consistent and processes do not revert to old habits.
Monitor Results
Teams monitor results using data collection and performance tracking tools. Continuous monitoring allows teams to spot issues early and make adjustments as needed. Employee training supports ongoing improvement and helps teams maintain discipline. Teams foster a culture of statistical thinking and process ownership, encouraging everyone to take responsibility for outcomes.
Strategies for sustaining process improvements:
Teams develop discipline to maintain new practices.
Continuous monitoring and improvement keep processes on track.
Employee training reinforces best practices.
Teams foster a culture of process ownership.
Monitoring results and training employees help teams sustain improvements and prevent backsliding.
Standardize Improvements
Standardizing improvements locks in gains and reduces variation. Teams create checklists for tasks, products, and processes. Standardized work minimizes errors and waste. Teams document new procedures and share them across departments. This approach ensures everyone follows the same steps and maintains high-quality outcomes.
Teams use standardized work to minimize errors and waste.
Checklists and documentation support consistent performance.
Teams share best practices to promote continuous improvement.
Standardizing improvements helps teams maintain high performance and build a culture of excellence.
Types of Process Maps
SIPOC Diagram
A SIPOC diagram gives teams a high-level overview of a process. It stands for Suppliers, Inputs, Process, Outputs, and Customers. Teams use SIPOC diagrams at the start of Lean Six Sigma Process Mapping projects to clarify boundaries and expectations. This diagram helps everyone understand who provides resources, what those resources are, how the process works, what comes out of it, and who receives the final product or service.
Component | Description |
|---|---|
Suppliers | Entities that provide inputs to the process. |
Inputs | Resources or materials required for the process. |
Processes | The steps taken to transform inputs into outputs. |
Outputs | The final products or services delivered to customers. |
Customers | The end-users or recipients of the outputs. |
Teams often use SIPOC diagrams to identify inefficiencies by mapping inputs and outputs. This tool improves communication and collaboration among departments. It also reduces defects and variations in processes. SIPOC diagrams help teams spot errors and bottlenecks early, making them valuable in the initial phase of any improvement project.
SIPOC diagrams establish clarity and align team expectations, which supports successful project outcomes.
High-Level Map
A high-level map shows the main steps of a process without going into much detail. Teams use this map to get a quick understanding of how work flows from start to finish. High-level maps often use simple boxes and arrows to represent each step. This type of map helps teams see the big picture and decide where to focus improvement efforts.
High-level maps are useful for:
Explaining processes to new team members.
Identifying major stages and handoffs.
Setting the scope for more detailed mapping.
Teams can use block diagrams or flow charts for high-level mapping. These maps grow in detail as teams learn more about the process. High-level maps help teams avoid getting lost in minor details and keep improvement projects on track.
Detailed Map
A detailed map breaks down each step of a process. Teams use this map to analyze how work moves through every stage. Detailed maps include decisions, actions, and handoffs. They show where non-value-added activities occur and help teams find areas for improvement.
Features of detailed maps:
Use flowcharts to show every step and decision.
Identify bottlenecks and waste.
Support root cause analysis.
Teams often use flow process charts to highlight non-value-added activities. Detailed maps help teams understand the process deeply and make targeted changes. These maps are essential when teams want to reduce errors, improve quality, and streamline operations.
Teams who use detailed maps can pinpoint inefficiencies and prioritize improvement opportunities.
Lean Six Sigma Process Mapping relies on different types of process maps to guide teams through improvement projects. Each map serves a unique purpose and helps teams achieve clarity, efficiency, and lasting results.
Swimlane Diagram
Swimlane diagrams help teams visualize complex processes that involve multiple departments or individuals. Each "lane" represents a specific group, such as a department or a role. Tasks and decisions appear in the lanes, showing who is responsible for each step. This structure makes it easy to see how work moves across the organization.
Teams use swimlane diagrams in Lean Six Sigma Process Mapping to clarify responsibilities and improve collaboration. The diagram shows the sequence of activities and highlights handoffs between groups. When teams review the diagram, they can spot delays, redundancies, and bottlenecks. This approach helps organizations streamline workflows and reduce errors.
The advantages of swimlane diagrams for cross-functional process mapping include:
Advantage | Description |
|---|---|
Swimlane diagrams clearly show which department or individual is responsible for each task. | |
Improved Communication | By visualizing how work flows between different departments or individuals, swimlane diagrams facilitate better communication and collaboration across an organization. |
Identification of Inefficiencies | These diagrams make it easier to identify redundancies, bottlenecks, and inefficiencies in complex processes. |
Teams often use swimlane diagrams during process improvement projects. They can quickly identify which steps cause delays or confusion. The diagram also helps teams assign tasks and monitor progress. When teams update the diagram, they can track changes and ensure everyone follows the new process.
Swimlane diagrams provide a clear view of responsibilities and make it easier for teams to work together. This tool supports continuous improvement and helps organizations achieve better results.
Value Stream Map
Value stream mapping gives teams a powerful way to analyze how products and services move through a process. The map shows every step, from the beginning to the end, and highlights how materials and information flow. Teams use value stream maps to find waste and improve efficiency.
The role of value stream mapping in Lean Six Sigma Process Mapping includes:
Step | Description |
|---|---|
1 | Create an as-is current state process of how an organization delivers products and services to the customers. |
2 | Identify wastes in the process and draw the proposed improved state map using lean principles. |
3 | Develop action plans to achieve the proposed improved future state. |
Teams follow these steps to build a value stream map:
Identify waste: Teams pinpoint activities that do not add value from the customer’s perspective.
Improve process flow: Teams make the flow of materials and information smoother and more efficient, which leads to reduced cycle time.
Value stream mapping helps organizations visualize the eight types of waste in Lean. By removing waste, teams create a more efficient process. The map also helps teams develop action plans for improvement. When teams compare the current state to the future state, they can measure progress and track results.
Value stream maps help teams see the entire process and focus on what matters most. This tool supports Lean Six Sigma Process Mapping by making waste visible and guiding teams toward better performance.
Creating and Refining a Process Map
Preparation and Team Alignment
Successful Lean Six Sigma Process Mapping begins with careful preparation and team alignment. Teams identify the process to map by considering its impact on business strategy, customer experience, or operational efficiency. They assemble a cross-functional group that includes process owners and subject matter experts. This approach ensures diverse perspectives and accurate input. Teams gather data and information about the current process through observation, interviews, and review of existing documentation. These steps help everyone understand the process and set clear objectives.
Recommended steps for preparation and alignment:
Identify the process to map based on strategic importance or operational impact.
Assemble a mapping team with process owners and subject matter experts.
Gather data through observation, interviews, and documentation review.
Teams that invest time in preparation and alignment build a strong foundation for accurate process mapping.
Mapping the Current State
Teams create a visual representation of the current process. They use flowcharts, SIPOC diagrams, or swimlane diagrams to show each step, decision, and handoff. The mapping team works together to ensure the diagram reflects real-world operations. They document every action, including who performs each task and when it occurs. This process helps teams spot inefficiencies, redundancies, and bottlenecks.
Teams often use sticky notes or digital tools to arrange steps in sequence. They encourage open discussion to capture all relevant details. The current state map serves as a baseline for future improvements. Teams review the map to confirm accuracy and completeness.
Teams use flowcharts to visualize the sequence of steps.
SIPOC diagrams provide a high-level overview of suppliers, inputs, process, outputs, and customers.
Swimlane diagrams clarify responsibilities across departments.
Mapping the current state gives teams a clear picture of how work flows and where problems may exist.
Validating and Refining
Validation ensures the process map accurately represents the real process. Teams use several methods to check for completeness and correctness. They review the map with stakeholders and subject matter experts. Feedback helps identify missing steps or unclear areas.
Tool | Description |
|---|---|
Flowcharts | Visual diagrams that map out the sequence of steps in a process. |
SIPOC Diagrams | High-level maps that outline Suppliers, Inputs, Process, Outputs, and Customers. |
Teams apply techniques such as the 5 Whys and cause and effect diagrams to refine the map. The 5 Whys method involves asking "why" multiple times to uncover root causes. Cause and effect diagrams help teams understand relationships between actions and outcomes.
5 Whys: Teams ask "why" repeatedly to find the root cause of issues.
Cause and Effect Diagrams: Teams use these visual tools to link causes with effects.
Teams update the map based on feedback and analysis. They ensure the process map is clear, accurate, and ready for improvement activities.
Validating and refining the process map helps teams avoid errors and supports successful Lean Six Sigma Process Mapping projects.
Identifying Improvements
Teams use process maps to spot areas where they can make changes that boost efficiency and quality. After validating the current map, they look for steps that waste time, cause errors, or add no value. They focus on actions that slow down the process or create confusion. Teams often ask, “Does this step help the customer?” If the answer is no, they consider removing or changing it.
To identify improvements, teams follow a structured approach:
Review the process map with all stakeholders.
Highlight steps that cause delays or mistakes.
Use data to confirm which steps need attention.
Brainstorm possible solutions for each problem area.
Prioritize changes that will have the biggest impact.
Teams rely on data-driven decision making. They collect facts and figures to support their choices. This prevents teams from making changes based on guesses. Teams also keep a continuous improvement mindset. They look for ways to make small changes that add up over time. This helps them avoid big disruptions and keeps the process stable.
The following table shows key criteria teams use to identify improvement opportunities:
Criteria | Description |
|---|---|
Data-Driven Decision Making | Teams use facts and figures to guide improvements, ensuring changes are based on real evidence. |
Continuous Improvement Mindset | Teams focus on finding and fixing waste and defects for long-term success. |
Project Selection | Teams choose high-impact processes to maximize results and return on investment. |
Teams select projects that offer the greatest benefit. They target processes that affect many people or cost the most money. By concentrating on high-impact areas, teams achieve better results and make the most of their resources.
Tip: Teams should involve people who work with the process every day. These individuals often know where problems occur and can suggest practical solutions.
Common pitfalls include ignoring data, making too many changes at once, or failing to involve key stakeholders. Teams avoid these mistakes by following a step-by-step plan and checking their progress. They document each improvement and monitor results to ensure lasting success.
Lean Six Sigma Process Mapping helps teams see where improvements are needed. By using data and focusing on high-impact areas, teams create processes that work better for everyone.
Tools for Lean Six Sigma Process Mapping
Digital Mapping Tools
Digital mapping tools help teams visualize and improve business processes. These tools allow users to create flowcharts, diagrams, and dashboards that show each step in a process. Teams use these tools to spot bottlenecks and track progress. Many platforms now offer features that support real-time updates and collaboration. The following table highlights common tool types and their roles in Lean Six Sigma projects:
Tool Type | Description |
|---|---|
Data Visualization Dashboards | Transform raw metrics into actionable insights, enabling real-time monitoring of process performance. |
Workflow Automation | Streamlines Lean Six Sigma processes by automating tasks and reducing manual errors. |
Project Tracking | Connects all phases of DMAIC with clear ownership and progress indicators for better accountability. |
Performance Monitoring | Integrates metrics into control plans for continuous feedback and sustained improvement. |
Teams often choose digital mapping tools that support drag-and-drop features and easy sharing. These tools help everyone see the process and understand where changes are needed.
Digital mapping tools make it easier for teams to communicate and act quickly when problems arise.
Collaboration Platforms
Collaboration platforms play a key role in Lean Six Sigma Process Mapping. These platforms help teams work together, even when members are in different locations. A process map serves as a communication tool, fostering a shared understanding of processes among team members. Teams use these platforms to create and update process maps together. They can also leave comments, ask questions, and share feedback in real time.
Collaboration platforms enable the creation of detailed Value Stream Maps (VSMs), which help visualize and enhance processes.
Teams can assign tasks, set deadlines, and track progress within the platform.
These features help teams stay organized and focused. They also make it easier to involve stakeholders and gather input from everyone involved.
Teams that use collaboration platforms often finish projects faster and with fewer mistakes.
Data Analysis Software
Data analysis software supports Lean Six Sigma teams by helping them collect, manage, and analyze data. This software allows users to find waste, measure performance, and test improvements. The right software can also simulate changes and predict their impact. The table below lists important features to consider:
Feature | Description |
|---|---|
Data Analysis Capabilities | Enables users to collect, manage, and analyze data, essential for identifying waste and inefficiencies. |
Process Mapping and Simulation | Visualizes processes and simulates improvements, aiding in understanding workflow and predicting impacts. |
Continuous Improvement Tracking | Monitors progress of improvement projects and tracks KPIs, crucial for managing Lean Six Sigma initiatives. |
Teams select software that matches their needs and supports continuous improvement. They use these tools to monitor key performance indicators and ensure that changes lead to real results.
Data analysis software gives teams the power to make decisions based on facts, not guesses.
Best Practices and Pitfalls
Effective Mapping Tips
Teams achieve better results when they follow proven strategies for Lean Six Sigma Process Mapping. Case studies show that involving the right people leads to more accurate maps. Individuals who work directly with the process provide valuable insights. Teams keep maps simple so everyone can understand them. Using standard symbols helps maintain clarity and consistency. Focusing on value-adding activities allows teams to identify and remove waste. The process map also serves as a communication tool, helping team members share ideas and stay aligned.
Involve people who work with the process every day.
Keep maps straightforward and easy to read.
Use standard symbols for consistency.
Highlight steps that add value and eliminate those that do not.
Use the map to improve communication among team members.
Teams often customize Lean Six Sigma approaches to fit their organization. They use methods like DMAIC and Kaizen to drive improvements. Adapting these strategies helps teams meet unique business needs.
Teams that use process maps as a shared language build stronger collaboration and achieve lasting improvements.
Mistakes to Avoid
Common pitfalls can slow progress or reduce the impact of process mapping. Teams sometimes jump to solutions before finishing the current state map. They need to see the whole picture first. Mapping the ideal process instead of the actual one leads to confusion. Teams must use real-world data as their baseline. Ignoring the voice of frontline workers results in maps based on assumptions. Teams should always involve those who live the process.
Other mistakes include blind use of process maps without understanding business differences. Lack of clarity about problem causes can make mapping ineffective. Teams may focus too much on creating a perfect map, which distracts from the goal. Not measuring improvements leads to unclear results. Limited process ownership makes it hard to sustain changes. Teams sometimes confuse attractive visuals with real value.
Avoid redesigning before mapping the current state.
Map how the process works, not how it should work.
Involve frontline workers for accurate input.
Do not focus only on aesthetics.
Measure improvements to track progress.
Share process ownership across teams.
Teams that avoid these mistakes create maps that drive real change and support continuous improvement.
Real-World Examples
Organizations have seen measurable benefits from Lean Six Sigma Process Mapping. Marketing teams improved communication and clarified roles, reducing campaign delivery times by 30% and increasing team satisfaction. Manufacturing teams identified bottlenecks and standardized processes, boosting productivity and cutting operational costs by 20%. Tech companies enhanced collaboration between development and support teams, reducing response times for customer issues by 40% and improving morale.
Case Study | Description | Outcome |
|---|---|---|
Marketing Team | Improved communication and clarified roles. | Reduced campaign delivery times by 30%. |
Manufacturing Team | Identified bottlenecks and standardized processes. | Increased productivity and reduced costs by 20%. |
Tech Company | Enhanced collaboration between teams. | Reduced response times by 40%. |
A manufacturing company cut lead times from 14 days to 7 days by automating procurement and improving supplier communication. Healthcare organizations use Value Stream Mapping to visualize patient journeys, optimizing workflows for timely and effective care.
Real-world results show that process mapping leads to faster delivery, lower costs, and improved satisfaction.
Sustaining Process Improvements
Embedding Mapping in Culture
Teams embed process mapping into their culture by making it a routine part of daily operations. Leaders encourage everyone to use process maps when solving problems or planning new projects. Employees see process mapping as a tool for clear communication and accountability. When teams update maps regularly, they keep workflows transparent and easy to follow. Managers reward those who use process maps to drive improvements. This approach helps organizations maintain high standards and adapt quickly to changes.
Tip: Teams should display process maps in common areas or share them digitally. This practice keeps everyone informed and supports a culture of openness.
Training and Learning
Continuous training helps teams master process mapping techniques. Organizations offer workshops and online courses to teach employees how to create and refine process maps. New hires learn mapping basics during onboarding. Experienced staff attend advanced sessions to deepen their skills. Teams practice mapping real processes and review case studies from their industry. Leaders encourage employees to ask questions and share lessons learned. This focus on learning ensures that everyone stays up to date with best practices.
Key elements of effective training:
Hands-on practice with real processes
Access to digital mapping tools
Regular feedback from experts
Opportunities to learn from successful projects
Training Type | Description |
|---|---|
Workshops | Interactive sessions for skill-building |
Online Courses | Flexible learning for all employees |
Peer Review | Sharing feedback and insights |
Measuring Success
Teams measure the success of process improvements by tracking key performance indicators. They monitor metrics such as cycle time, error rates, and customer satisfaction. Leaders review these numbers to see if changes deliver real benefits. Teams use dashboards to visualize progress and spot trends. When results fall short, they adjust their approach and try new solutions. Regular measurement keeps everyone focused on goals and helps sustain improvements.
Teams track progress with simple charts and graphs.
Leaders set clear targets for each process.
Employees celebrate milestones and share achievements.
? Teams that measure success build confidence and motivate everyone to keep improving. Lean Six Sigma Process Mapping supports this effort by providing a clear framework for tracking and sustaining results.
Lean Six Sigma process mapping gives teams a clear path to improvement. They define processes, measure performance, analyze inefficiencies, and implement solutions. Clients at systems and teams have achieved lasting results by following these steps. Teams see reduced errors and faster delivery.
Start mapping projects today.
Explore resources for ongoing learning.
For more guidance or to achieve similar results, readers can contact systems and teams.
FAQ
What is the main purpose of Lean Six Sigma process mapping?
Lean Six Sigma process mapping helps teams visualize each step in a process. This tool allows them to find waste, reduce errors, and improve efficiency. Teams use maps to guide improvement projects and support clear communication.
How often should teams update their process maps?
Teams should update process maps whenever they change a process or find new issues. Regular reviews help keep maps accurate and useful. Many organizations review maps quarterly or after major improvements.
Which process mapping tool works best for beginners?
SIPOC diagrams work well for beginners. These diagrams provide a simple overview of suppliers, inputs, processes, outputs, and customers. Teams can start with SIPOC before moving to more detailed maps.
Can digital tools replace traditional process mapping methods?
Digital tools can make process mapping faster and easier. They allow teams to collaborate in real time and update maps quickly. However, understanding basic mapping concepts remains important for success.
What are common mistakes teams make during process mapping?
Teams sometimes skip mapping the current state or ignore input from frontline workers. Others focus too much on perfect visuals instead of real problems. Teams should always map actual processes and involve everyone affected.
How does process mapping support continuous improvement?
Process mapping gives teams a clear view of workflows. This clarity helps them spot problems and track progress over time. Teams use maps to test changes, measure results, and keep improving.
Why should organizations embed process mapping in their culture?
Embedding process mapping in the culture ensures everyone uses the same approach to solve problems. This practice builds accountability, supports training, and helps teams adapt to change.
What skills help teams succeed with Lean Six Sigma process mapping?
Teams need strong observation, communication, and data analysis skills. They should also understand mapping tools and basic Lean Six Sigma principles. Training and hands-on practice help teams build these skills.


