How to Achieve Continuous Improvement in Business Processes
Continuous improvement in business processes relies on structured methodology and data-driven decision making. Companies use systems like Six Sigma and Lean to measure performance and reduce errors. For example:
One company saved $40,000 in ten months.
Vendor management improvements added $192,000 in annual savings.
Process optimization of business processes brings clear benefits:
Efficiency rises as teams identify and remove bottlenecks.
Resources are used wisely, cutting costs and boosting output.
Consistent quality supports customer satisfaction and compliance.
Key Takeaways
Continuous improvement means making small, regular changes to business processes to boost quality and efficiency.
Using data and feedback helps teams find problems and measure progress accurately.
Mapping workflows visually reveals bottlenecks and waste, guiding better decisions.
Standardizing processes reduces errors, speeds training, and improves customer satisfaction.
Automation and AI save time by handling repetitive tasks and help make faster, smarter decisions.
Setting clear, measurable goals keeps teams focused and drives steady progress.
Regular monitoring and feedback loops ensure improvements last and adapt to new challenges.
Strong leadership, open communication, and recognizing team efforts build a culture that supports ongoing improvement.
Continuous Improvement Overview
Definition
Continuous improvement describes a systematic approach where organizations seek to enhance their processes, products, or services over time. This method relies on regular evaluation and incremental changes. Teams use data and feedback to identify areas that need improvement. They then implement changes, monitor results, and repeat the cycle. Many companies adopt frameworks such as Total Quality Management (TQM), Six Sigma, or the PDCA (Plan-Do-Check-Act) cycle to guide their efforts. These frameworks encourage everyone in the organization to participate in making things better.
Importance
Continuous improvement holds a central place in successful businesses. It helps organizations adapt to changing markets and customer needs. Companies that focus on ongoing improvement often see measurable benefits:
Key Performance Indicators (KPIs) track progress toward business goals. Both lagging indicators, like past sales, and leading indicators, such as new client meetings, help teams stay on target.
Regular measurement and analysis allow organizations to adjust strategies quickly when results fall short.
Data-driven decisions reduce guesswork and help maintain a competitive edge.
Statistical tools, such as control charts and process capability indices, support the detection of trends and process stability.
Businesses that use continuous improvement methods report significant gains. For example, organizations using TQM have seen an average 20% reduction in costs and higher customer satisfaction.
Continuous improvement is not a one-time project. It is a mindset that encourages constant learning and adaptation.
Principles
Several core principles guide continuous improvement. These principles help organizations create a culture where progress becomes part of daily work.
Customer Focus: Companies put customer needs first. They use feedback surveys and process audits to understand what matters most.
Employee Involvement: Every team member contributes ideas and solutions. Engagement leads to better results.
Fact-Based Decision Making: Leaders rely on data, not assumptions. Statistical analysis, such as regression or ANOVA, helps identify root causes and measure outcomes.
Process Orientation: Teams map workflows and look for ways to reduce waste or defects.
Iterative Approach: Improvement happens in cycles. The PDCA cycle, for example, encourages planning, testing, checking, and acting on results.
Framework/Methodology | Key Principles | Statistical Tools | Outcome Measurement |
|---|---|---|---|
TQM | Customer-first, employee engagement, fact-based decisions | Surveys, SPC charts | Customer satisfaction, cost reduction |
Six Sigma | Defect reduction, data-driven action | Process mapping, DOE | Near-zero defects, validated improvements |
PDCA Cycle | Iterative change, root cause analysis | Metric tracking, monitoring | Sustained improvements, reduced waste |
These principles and tools work together to create a proactive, data-driven culture. Organizations that follow them can respond quickly to challenges and sustain long-term success.
Optimization of Business Processes

Process Mapping
Process mapping forms the foundation for the optimization of business processes. It provides a visual representation of each step in a workflow, making it easier to spot redundancies, delays, or unnecessary actions. Organizations use several mapping techniques, such as value stream mapping, SIPOC diagrams, flowcharts, and swimlane diagrams. Each method serves a different purpose. For example, flowcharts work well for simple workflows, while swimlane diagrams help clarify cross-departmental processes.
Many companies have improved efficiency by applying these techniques. Toyota’s Production System uses value stream mapping to increase throughput. A pharmaceutical company improved equipment effectiveness by 25% after mapping its processes. An automotive parts manufacturer increased throughput by 30% and reduced work-in-process inventory by 20%. These results show that process mapping supports data-driven decisions and continuous improvement.
Tip: Select the right mapping tool for the workflow. Use flowcharts for simple tasks, BPMN for complex processes, and value stream maps to target waste.
Identifying Inefficiencies
After mapping, teams can identify inefficiencies that slow down operations or waste resources. Common issues include manual processes, siloed operations, and duplicated tasks. Manual work often leads to errors and employee frustration. Automating tasks like lead tracking or inventory management reduces mistakes and saves time. Siloed operations create disconnected workflows, causing teams to repeat work or miss important information.
Case studies highlight these problems. For example, supply chain bottlenecks often appear during operational analysis. By using data and technology, companies reduce waste and improve resource allocation. In customer service, analyzing call durations and representative performance helps managers provide targeted training. This leads to better service quality and higher customer satisfaction.
A 25% reduction in process cycle time occurred after employee-driven improvements.
Systematic enhancements led to a 20% increase in product yield.
Customer satisfaction scores improved as a result of these changes.
Recent research supports these findings. The KHB method, a hybrid optimization approach, increased productivity by 22.93% and cut production costs by 20.96% in a valve production case. In garment manufacturing, productivity rose by 19.78% with a 9.78% cost reduction.
Standardization
Standardization ensures that everyone follows the same steps for each process. This consistency reduces errors, speeds up training, and makes it easier to measure performance. Standardized processes also support compliance with regulations and improve customer experience.
Organizations measure the success of standardization using key performance indicators (KPIs). These include average handling time, rework rate, purchase process lead time, and customer response service level agreements (SLAs). Other important metrics are conversion rates, sales cycle length, error rates, employee productivity, and customer satisfaction scores.
Decrease in error rates
Increase in employee productivity
Improvement in customer satisfaction scores
Higher regulatory compliance rates
KPIs should be specific, measurable, achievable, relevant, and time-bound. Regular reviews, employee feedback, and audits help ensure that standardized processes remain effective and continue to improve.
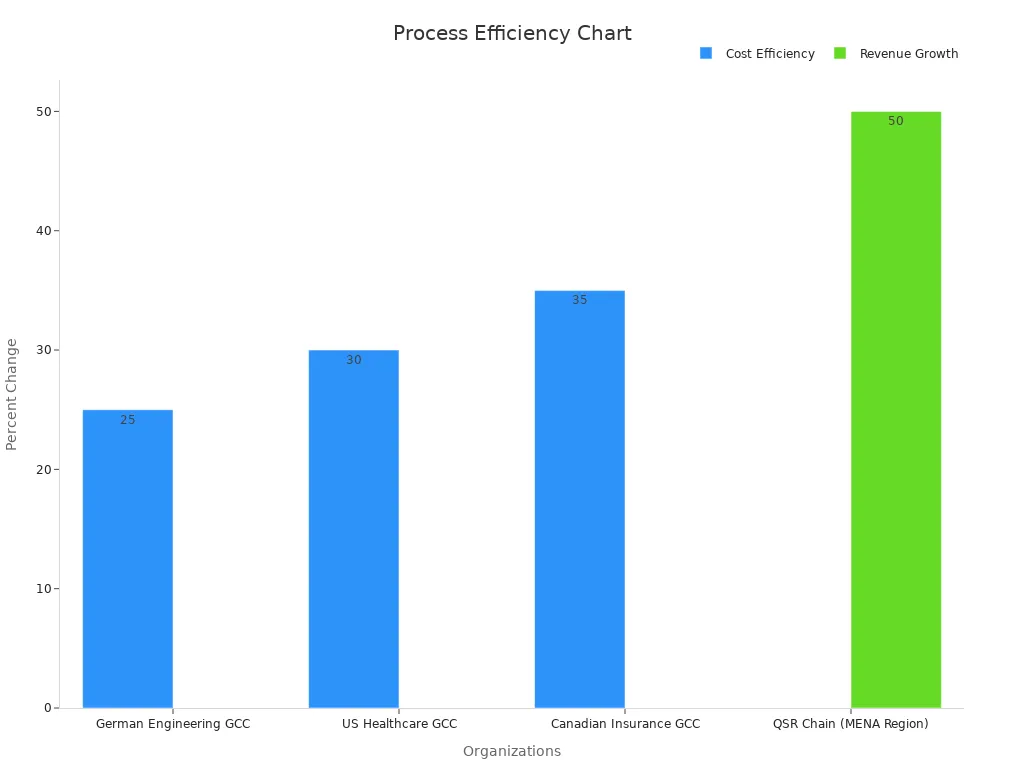
Organization / Sector | Initiative / Methodology | Quantified Results / Metrics |
|---|---|---|
German Engineering GCC | Cognitive Quality Model | |
US Healthcare GCC | Operating Model Redesign | 30% drop in quality-related costs |
Canadian Insurance GCC | Workflow Automation & Digitization | 35% reduction in capacity needs over two years |
FMCG Company | Customer-Centric Product Design | Breakthrough product development (qualitative impact) |
QSR Chain (MENA Region) | Outlet Location Strategy | 50% increase in brand visibility and revenue growth |
Automobile Manufacturer | Digitalizing Customer Lifecycle | Reduced customer response times and faster turnaround |
The optimization of business processes relies on mapping, identifying inefficiencies, and standardizing workflows. These steps help organizations achieve measurable gains in efficiency, cost savings, and customer satisfaction.
Automation and AI
Automation and artificial intelligence (AI) have transformed the optimization of business processes across many industries. Companies now use these technologies to handle repetitive tasks, analyze large amounts of data, and make faster decisions. Automation tools can manage tasks like data entry, invoice processing, and scheduling. AI systems can learn from data, predict trends, and even interact with customers through chatbots.
Many organizations see measurable improvements after adopting automation and AI. In the insurance sector, one company used large language models to automate the identification of claim parts. This task once created a bottleneck and limited how much work the team could handle. By applying object-centric process mining, the company measured the impact of AI-driven automation. The results showed a clear increase in operational capacity and process scalability. The team could now handle more claims with fewer delays. However, new process patterns appeared, showing that ongoing monitoring and refinement remain important.
Several industries have reported similar gains:
Blue River Technology in agriculture reduced chemical usage and increased crop yields.
Salesforce improved customer engagement and satisfaction, leading to business growth.
Siemens in industrial automation increased productivity, reduced downtime, and improved manufacturing quality.
Ford enhanced vehicle safety features and improved the driving experience.
These examples highlight how automation and AI support the optimization of business processes by increasing efficiency and improving outcomes.
Case Study | Industry | AI Application | Quantifiable Impact |
|---|---|---|---|
AI-Enhanced Customer Support | Financial Services | AI-powered chatbot with NLP | 60% reduction in response times; 40% increase in customer satisfaction |
AI-Optimized Manufacturing | Automotive | Predictive maintenance and scheduling | 50% reduction in unplanned downtime; 20% increase in production output; $2M annual savings |
AI-Driven Marketing Personalization | E-commerce | Recommendation engine | 25% increase in conversion rates; 15% reduction in customer churn; higher average order value |
AI-Powered Fraud Detection | Payment Processing | Real-time transaction analysis | 90% accuracy in fraud detection; $5M saved annually; improved compliance |
Note: Automation and AI do not replace the need for human oversight. Teams must monitor new workflows and adjust them as needed to ensure continued improvement.
The optimization of business processes benefits from automation and AI by reducing manual work, increasing speed, and improving accuracy. These technologies help companies stay competitive and adapt to changing demands. As more organizations adopt automation and AI, the potential for further gains in efficiency and quality continues to grow.
Step-by-Step Approach
Process Selection
Selecting the right process for improvement sets the foundation for successful continuous improvement. Organizations often face many choices, so they need a structured approach to decide where to focus their efforts. Teams start by identifying potential projects that align with business goals, technical capabilities, available time, and budget. They then use project selection methods such as cost-benefit analysis to score each option. This scoring system ranks projects by value, cost-effectiveness, and strategic fit. The process with the highest score, which offers the most value at the lowest cost and best matches company objectives, becomes the top candidate for optimization.
Tip: Use internal metrics and scoring systems to ensure decisions are data-driven and support business objectives.
A typical process selection phase includes:
Planning Phase: Define objectives, allocate resources, develop timelines with milestones, set budgets, form teams, and establish documentation systems. This phase usually takes 3-6 months, depending on complexity.
Risk Assessment: Apply structured tools like Failure Mode and Effects Analysis (FMEA) to identify critical process parameters. Teams evaluate severity, occurrence, and detection to prioritize risks.
Data Collection Protocols: Set up automated systems for real-time data capture and supplement with manual checks for visual inspections and operator observations.
This structured approach ensures that organizations choose processes with the greatest potential for improvement and measurable impact.
Goal Setting
Clear goals drive continuous improvement. Teams set specific, measurable, attainable, relevant, and time-bound (SMART) goals to guide their efforts. Numerical performance data provides a reliable way to track progress and hold everyone accountable. Goals should be easy to understand, visible to all stakeholders, and realistic based on current performance.
Organizations use baseline data and gap-to-success measures to set targets that are both challenging and achievable. Visual management tools, such as dashboards, help teams monitor progress in real time and make quick adjustments when needed. Employee feedback, combined with performance metrics, refines goals and embeds improvement into the company culture.
Benchmark Example | Numerical Benchmark/Data | Impact/Result Description |
|---|---|---|
Customer Service Response Time | Reduce from 24 hours to 2 hours | Demonstrates precision in goal setting for process speed |
Market Share Increase (Tech Firm) | 40% increase in market share within 2 years | Shows significant business growth through benchmark setting |
Patient Recovery Rates (Healthcare) | 30% improvement in recovery rates | Highlights healthcare quality improvement via benchmarks |
Positive Feedback Rate | Achieve 95% positive feedback on surveys | Quantifies customer satisfaction goals |
Writing Milestone | Write 1,000 words daily | Example of incremental milestone for continuous progress |
Effective goal setting involves analyzing historical data, aligning with industry standards, and setting incremental milestones. Regular reviews and adjustments keep goals relevant and ensure continuous progress.
Note: Avoid focusing only on metrics. True improvement comes from meaningful changes, not just hitting numbers.
Analysis
Analysis transforms data into actionable insights. Teams collect data from automated systems and manual observations to understand how processes perform. They use descriptive statistics, such as mean, median, and standard deviation, to summarize data and spot patterns. Inferential statistics, including t-tests, ANOVA, and regression analysis, help teams test hypotheses and draw conclusions about process changes.
A typical analysis phase includes:
Hypothesis Formulation and Research Design: Define clear questions and plan how to collect and analyze data.
Data Collection: Gather information from representative samples using surveys, experiments, or interviews. Ensure data quality and minimize bias.
Descriptive Statistics: Summarize data to identify trends and variability.
Inferential Statistics: Use statistical tests to determine if changes are significant.
Results Interpretation: Analyze findings in context, considering both statistical and practical significance.
Teams also use tools like Design of Experiments (DoE) to study how different factors interact and optimize processes. Statistical Process Control (SPC) tools, such as control charts and capability analysis, help monitor ongoing performance and detect trends.
Teams that analyze workflow data often uncover hidden inefficiencies. For example, one company identified delays in forklift battery changes and saved $75,000 annually by scheduling the process more effectively.
Analysis ensures that decisions are based on facts, not assumptions. This step helps organizations identify root causes, measure the impact of changes, and sustain improvements over time.
Implementation
Implementation turns analysis and planning into real change. Teams move from identifying solutions to putting them into action. This stage requires careful coordination, clear communication, and ongoing measurement to ensure that improvements deliver results.
A successful implementation starts with defining clear objectives that align with the organization’s strategy. Teams identify the key processes that impact these objectives and select relevant metrics, such as efficiency, cycle time, or process yield. Consistent and accurate data collection helps track performance from the start.
Tip: Start with small-scale tests, often called mini-cycles, before rolling out changes across the entire organization. This approach allows teams to refine improvements and reduce risk.
The following steps outline a structured implementation process:
Set Clear Objectives: Teams define what success looks like and how it will be measured.
Select Key Processes: Focus on areas that have the greatest impact on business goals.
Establish Metrics: Choose specific measures like cycle time, error rates, or resource utilization.
Collect Data: Use automated systems and manual checks to gather accurate information.
Test Interventions: Run small-scale pilots to see how changes affect performance.
Analyze Results: Review data from tests to determine what works and what needs adjustment.
Expand Successful Changes: Apply proven improvements to larger parts of the organization.
Organizations that follow these steps often see measurable enhancements in process performance. For example:
Comprehensive measurement of outcomes, such as patient satisfaction or resource utilization, leads to better decision-making.
Structured review processes, like monthly performance reviews and quarterly trend analysis, help teams stay on track.
Continuous monitoring and adjustment ensure that improvements last over time.
Teams use visual tools, such as run charts and control charts, to track progress. These tools provide ongoing records of process changes and highlight trends. Feedback from small-scale tests helps teams modify or sustain interventions based on real results.
Note: Proper implementation relies on teamwork and open communication. Everyone involved should understand their roles and the goals of the project.
By following a structured approach, organizations can demonstrate measurable improvements in both operational efficiency and quality. This process supports a culture of continuous improvement and sets the stage for long-term success.
Monitoring
Monitoring ensures that process improvements deliver lasting results. Teams track performance, detect issues early, and make adjustments as needed. Effective monitoring uses both real-time data and regular reviews to maintain high standards.
Several frameworks and tools support ongoing monitoring of business processes. These systems provide numerical data and visual insights that help teams understand how processes perform over time.
Monitoring Framework/Technique | Description | Supported Numerical Data / Metrics | Example Tools / Suites |
|---|---|---|---|
Business Activity Monitoring (BAM) | Real-time monitoring and analysis of business processes and activities. | KPIs such as cycle times, bottlenecks, SLA compliance | Software AG’s ARIS Process Performance Manager, Oracle BAM |
Process Mining | Analyzes event log data to discover, monitor, and improve processes. | Event logs, process deviations, compliance violations | Celonis, QPR ProcessAnalyzer, Signavio Process Intelligence |
Real-Time Monitoring | Continuous tracking of process activities to detect and resolve issues immediately. | Process metrics, anomaly detection, SLA breaches | Integrated in BPM suites and BAM tools |
Compliance Monitoring | Ensures adherence to regulatory requirements and internal policies. | Compliance levels, violation alerts | IBM Compliance Monitoring tools |
IT Operations Monitoring | Monitors IT infrastructure performance impacting business processes. | System metrics, logs, events | Splunk, Datadog, Dynatrace |
Business Process Management Suites | Comprehensive BPM tools offering dashboards, reports, alerts, and analytics. | Cycle times, error rates, throughput time, resource usage | Appian, Pegasystems, IBM BPM |
Teams use these frameworks to track key performance indicators (KPIs) such as cycle times, error rates, and compliance levels. Real-time monitoring and alerting help teams respond quickly to problems. Process mining tools reveal hidden bottlenecks and deviations from standard procedures.
Teams should review performance data regularly. Monthly reviews, quarterly trend analysis, and benchmark comparisons help identify areas for further improvement.
Monitoring also includes feedback loops. Teams gather input from employees and customers to spot new issues or opportunities. Automated monitoring reduces bias and increases accuracy, making it easier to maintain high standards.
By using these monitoring techniques, organizations can ensure that improvements remain effective and adapt to new challenges. Continuous monitoring supports a culture of accountability and drives ongoing success.
Data-Driven Improvement

Performance Analysis
Performance analysis helps organizations understand how well their processes work. Teams use data to find strengths and weaknesses. They often rely on structured methods like Six Sigma, Statistical Process Control, and predictive analytics. These methods use numbers and charts to show where improvements can happen. For example, Six Sigma uses the DMAIC framework to guide teams through defining, measuring, analyzing, improving, and controlling processes. This approach can boost productivity by up to 30% and cut defects by 40%.
Methodology/Technique | Description | Measurable Outcomes / Statistics |
|---|---|---|
Six Sigma (DMAIC Framework) | Structured approach using Define, Measure, Analyze, Improve, Control phases with statistical tools | |
Statistical Process Control (SPC) | Monitoring and controlling process variations through control charts | Defect reductions of up to 40%; improved quality and customer satisfaction |
Regression Analysis & Hypothesis Testing | Statistical techniques to identify root causes and validate improvements | Enables identification of inefficiencies and validation of solutions |
Predictive Analytics & Machine Learning | Use of advanced algorithms to forecast issues and optimize processes | 50% improvement in trading efficiency; 65% reduction in operational errors; predictive maintenance reduces downtime |
Data Visualization Tools | Tools like Tableau, Power BI for real-time dashboards and clear communication of metrics | Real-time tracking of KPIs; improved decision-making |
Real-World Industry Examples | Manufacturing, retail, financial sectors applying data-driven methods | Walmart: 25% inventory turnover improvement, 40% reduction in out-of-stock; Amazon: 50% reduction in order processing time |
Continuous Monitoring & Employee Involvement | Ongoing evaluation and engagement to sustain improvements | Sustained measurable outcomes; enhanced adoption and process control |
Teams also track metrics confirmed by academic research. These include ROI, product quality, time savings, safety, customer satisfaction, and employee satisfaction. Each metric gives a clear picture of how changes affect the business.
ROI (Return on Investment): Shows the financial impact of improvements.
Product Quality: Tracks defects, returns, and complaints.
Time Savings: Measures faster processes and higher output.
Safety: Counts fewer incidents and lower costs.
Customer Satisfaction: Uses surveys and ratings.
Employee Satisfaction: Checks engagement and retention.
KPIs
Key performance indicators (KPIs) help organizations measure progress. Teams select KPIs that match their goals and track them over time. Companies like Harley-Davidson and Siemens have used KPIs to achieve big results. For example, Harley-Davidson cut lead time from 21 days to 6 hours, a 75% reduction. Siemens improved productivity by 140%.
KPI / Metric | Description / Context | Empirical Validation / Results |
|---|---|---|
Cycle Time | Time taken to complete a process cycle | Harley-Davidson reduced lead time from 21 days to 6 hours (75% reduction) |
Defect Rates | Frequency of defects in processes or products | PDCA cycle used to reduce production defects through root cause analysis and corrective actions |
Customer Satisfaction (NPS, CES) | Measures how well products/services meet customer expectations | Higher NPS correlates with improved customer loyalty and streamlined operations |
Cost Reduction | Decrease in operational costs | Lean methodology reported 25-30% manufacturing cost reduction (McKinsey & Company) |
Resource Optimization | Efficient use of resources | BPR methodology achieved 65% reduction in cycle times and 75% cost decrease |
Productivity Improvement | Increase in output or efficiency | Siemens achieved 140% productivity improvement; Harley-Davidson 80% improvement |
Warranty Claims Reduction | Decrease in product/service warranty claims | Harley-Davidson reduced warranty claims by 70% |
Market Share Growth | Percentage of industry controlled by company | Harley-Davidson recovered 62% market share |
Return on Investment (ROI) | Profitability relative to investment costs | Industry Week reported 200% ROI from Lean implementations |
Employee Productivity | Efficiency and output of employees | PDCA cycle and Lean methodologies report improvements in employee productivity |
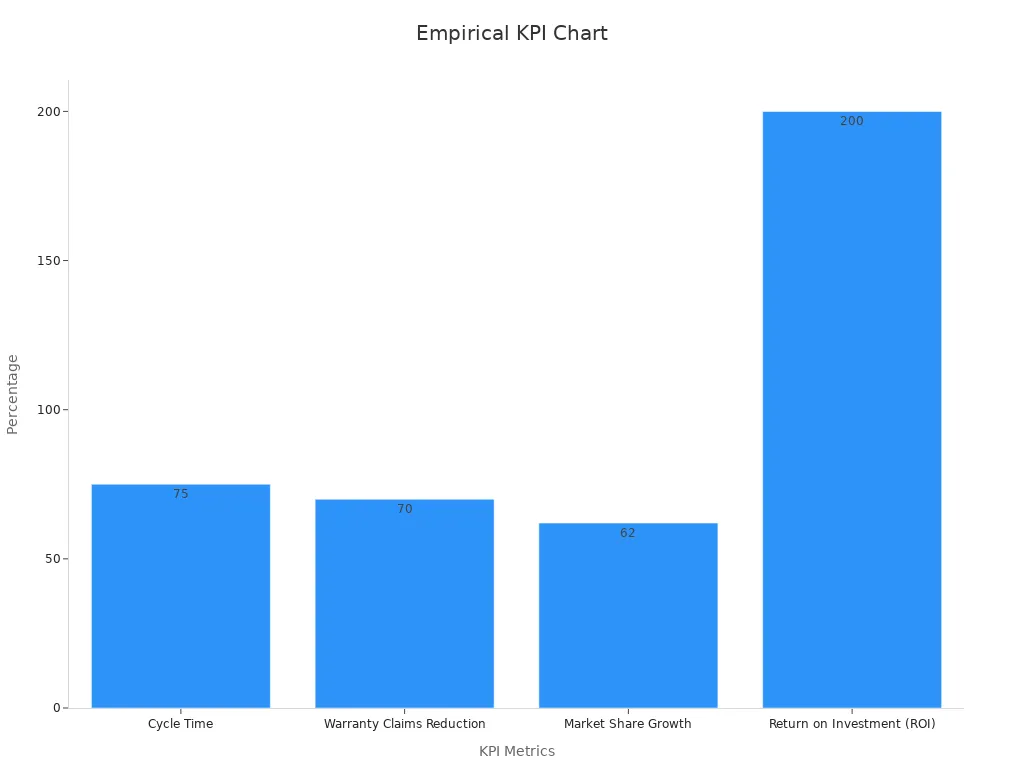
Teams use these KPIs to spot trends, set targets, and celebrate progress. Regular tracking helps everyone stay focused on what matters most.
Feedback Loops
Feedback loops create a cycle of learning and improvement. Teams collect feedback from employees and customers, then use it to refine processes. This approach leads to faster response times and fewer errors. For example, a software company reduced code defects by 40% after adding feedback loops. A hospital cut patient wait times by 25% using the same method.
Evidence Type | Description | Example / Impact |
|---|---|---|
Quantitative Metrics | Measurable improvements in operational performance through feedback loops. | Reduction in response times; decrease in error rates in deliverables. |
Qualitative Assessments | Insights from employee and customer feedback reflecting morale and service quality improvements. | Employee satisfaction surveys showing improved morale; customer feedback indicating better service. |
Case Studies | Real-world examples demonstrating performance gains from feedback loop implementation. | Software company reduced code defects by 40%; hospital cut patient wait times by 25%. |
Comparative Studies | Benchmarking organizational performance against industry standards to evaluate feedback loop effectiveness. | Organizations compare metrics to industry benchmarks to assess efficiency improvements. |
Continuous Improvement | Feedback loops fostering ongoing refinement and long-term efficiency gains critical for competitive advantage. | Sustained efficiency gains through iterative feedback and adaptation cycles. |
Teams that use feedback loops see both measurable and lasting improvements. Regular feedback helps organizations adapt quickly and stay ahead in a changing market.
Challenges
Change Resistance
Change resistance stands as one of the most common obstacles in business process improvement. Employees often feel uncertain or anxious when new systems or workflows appear. Research shows that psychological unpreparedness ranks as the top barrier. Many employees struggle to understand the need for change or feel comfortable with old routines. Lack of information about innovations and fear of failure also contribute to resistance. When teams do not receive enough communication or support, skepticism and low trust can grow.
Cause of Resistance to Change | Significance Rank | Description |
|---|---|---|
Psychological unpreparedness to understand changes | 1 | Employees may not feel ready for change. |
Inertia and habituation to old practices | 2 | Comfort with current routines slows adoption. |
Lack of innovation-related information | 3 | Poor communication about changes. |
Destruction of cohesive work groups | 4 | Change can disrupt team dynamics. |
Fear of potential failures | 5 | Worry about unsuccessful outcomes. |
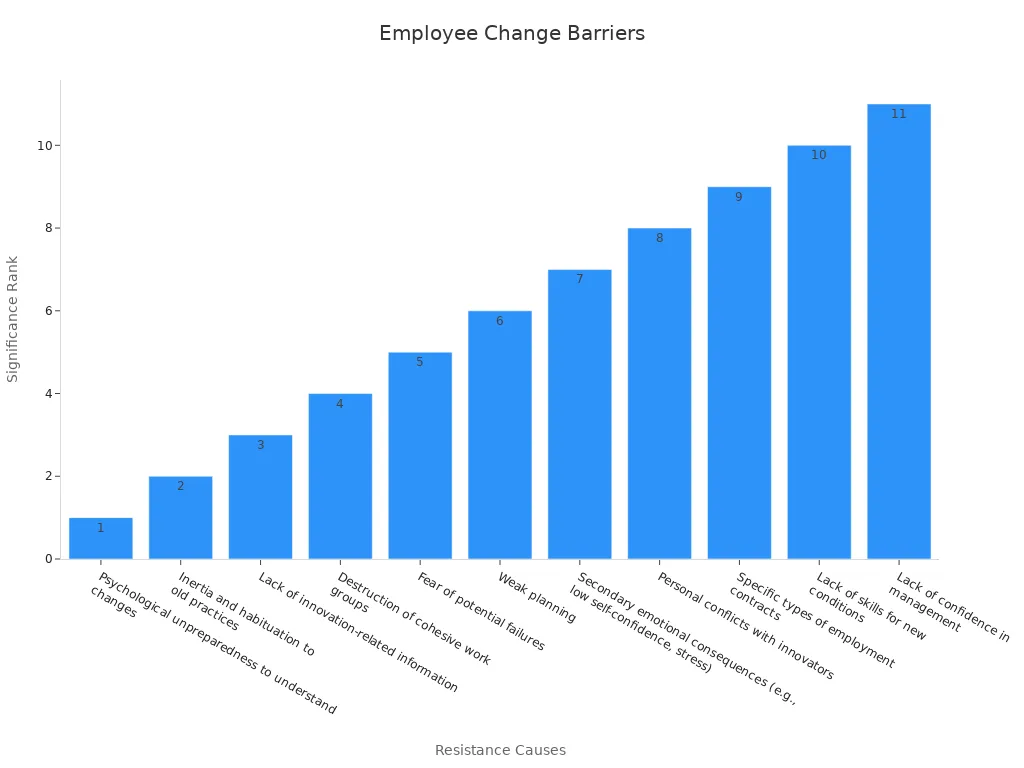
Surveys confirm that lack of follow-through, weak executive attention, and limited resources also block progress. A study at a public university found that employees who believed a change was appropriate felt more committed and adopted new systems more easily. Leaders who listen to concerns, align changes with company values, and set clear goals help reduce resistance.
Tip: Open communication and visible leadership support can lower resistance and build trust during transitions.
Resource Limits
Resource limits create another major challenge for continuous improvement. Many organizations face shortages in time, money, or skilled staff. These shortages slow down projects and reduce the quality of results. Metrics such as task completion rate and effort variance help track how resource gaps affect progress.
| Metric Name | Description | How it Demonstrates Resource Constraint Impact on Long-term Optimization | |----------------------|--------------------------------------------------------------------------------------------------|-------------------------------------------------------------------------------------------------|-------------------------------------------------| | Task Completion Rate | Percentage of tasks finished on time. Low rates signal delays or resource issues. | Delays and reduced productivity show resource limits. | (Completed Tasks / Total Tasks) × 100 | | Effort Variance | Difference between planned and actual effort. | Gaps reveal misallocation of resources. | Actual Effort - Planned Effort | | Scope Creep Percentage| Unplanned changes to project scope. | High scope creep increases resource strain. | (Total Change in Scope - Approved Changes) × 100 / Original Scope | | Change Request Rate | Approved changes in project scope. | Shows how resource limits affect change management. | (Approved Change Requests / Total Change Requests) × 100 |
Many industries report that implementing process improvements like Statistical Process Control (SPC) requires upfront investment in training, software, and infrastructure. Ongoing data collection and analysis need dedicated staff time. Without enough resources, even the best plans can stall. Lack of training also prevents employees from adapting to new processes.
Insufficient financial and human resources slow down improvement projects.
Lack of training makes it hard for employees to adjust.
Resource gaps can lead to missed deadlines and lower quality.
Sustaining Momentum
Keeping improvement efforts going over time presents a unique challenge. Teams often start strong but lose focus as daily work pressures return. Managers may struggle to maintain commitment, especially when results take time to appear. Without regular follow-up, early gains can fade.
Organizations that succeed in sustaining momentum set measurable short-term goals and celebrate small wins. Leaders play a key role by reinforcing the importance of improvement and providing ongoing support. Regular feedback, visible progress tracking, and recognition of team efforts help keep everyone engaged.
Sustained improvement depends on a culture that values learning, open feedback, and continuous support from leadership.
Best Practices
Culture
A strong culture of continuous improvement helps organizations achieve lasting success. Teams that value learning and open communication adapt more quickly to change. Many organizations use structured models to build this culture. These include PDCA (Plan-Do-Check-Act), FOCUS-PDCA, FADE, Lean, Six Sigma, Kaizen, and 5S principles. Each model provides a step-by-step approach for teams to plan, test, and refine their work. For example, Kaizen encourages small, practical changes from every employee, while Lean and Six Sigma focus on reducing waste and using data to guide decisions.
Long-term studies show that leadership plays a key role in shaping culture. Leaders who act as mentors and motivators help teams feel confident and connected. Communities of Practice (CoPs) bring people from different backgrounds together, which builds trust and encourages sharing of ideas. When leaders provide resources and support, employees feel empowered to take ownership of improvements. Flexible approaches that value autonomy and teamwork help organizations move away from rigid rules and create a sense of community.
Teams thrive when leaders model feedback, encourage open discussion, and celebrate learning. This environment supports ongoing improvement and innovation.
Innovation
Innovation drives continuous improvement by encouraging new ideas and creative problem-solving. Organizations that support innovation often use cycles like DMAIC (Define, Measure, Analyze, Improve, Control) and the Breakthrough Series to test and share new approaches. These methods help teams identify problems, develop solutions, and measure results.
Successful organizations also invest in training and resources. Training in feedback skills improves communication and reduces defensiveness. When teams know how to give and receive feedback, they can spot problems early and suggest better ways to work. Clear expectations about when and how to share feedback reduce uncertainty and help everyone participate. Trust and psychological safety allow team members to share ideas without fear of judgment.
A table of innovation best practices:
Practice | Benefit |
|---|---|
Feedback Skills Training | Better communication |
Clear Expectations | More participation |
Psychological Safety | More creative ideas |
Two-Way Feedback | Stronger collaboration |
Regular Check-ins | Faster problem-solving |
Organizations that make innovation part of daily work see faster improvements and higher employee engagement.
Recognition
Recognition motivates teams to keep improving. When leaders reward employees for sharing ideas or giving feedback, engagement rises. Studies show that recognizing feedback champions encourages others to join in. Regular feedback and recognition help teams feel valued and satisfied with their work.
Leaders can use several strategies to recognize contributions:
Celebrate small wins and milestones.
Highlight employees who model continuous improvement.
Provide rewards or public acknowledgment for active participation.
Hold regular meetings to discuss progress and share success stories.
Recognition does not always mean big rewards. Simple thank-yous, shout-outs in meetings, or small tokens can make a big difference.
By building a culture of recognition, organizations create a positive cycle. Employees feel appreciated, which leads to more ideas, better teamwork, and sustained improvement.
Case Studies
Success Stories
Many organizations have achieved remarkable results by applying continuous improvement strategies. These real-world examples show how different sectors benefit from structured approaches:
Manufacturing companies often combine automation, employee training, and a feedback culture. This approach reduces waste and bottlenecks, leading to higher productivity and better operational efficiency.
Service industries use Lean transformation to eliminate waste and engage employees. Data-driven decision-making helps streamline workflows and improve service delivery.
Toyota Motor Corporation set a global standard with the Toyota Production System (TPS). This system focuses on continuous improvement and waste reduction.
Boeing adopted Lean principles to make aircraft assembly more efficient.
Virginia Mason Medical Center used TPS concepts to improve patient safety and care efficiency.
Amazon applies Kaizen and TPS ideas in its fulfillment centers. These methods help optimize logistics and boost profitability.
Six Sigma’s DMAIC methodology gives teams a structured way to reduce defects and process variation. Many companies achieve near-perfect quality and strong returns on investment.
A leading technology company unified business and technical metrics. This change led to a 20% faster product launch speed and higher customer satisfaction.
A public sector agency used a balanced scorecard to track financial, customer, internal process, and learning metrics. This approach improved operational efficiency and transparency.
Organizations that focus on key performance indicators and continuous improvement loops can measure success through metrics like conversion rates and operational KPIs. This focus supports ongoing process optimization and measurable gains.
Lessons Learned
Documented outcomes from these case studies provide valuable lessons for any business seeking improvement. The following points highlight measurable learning and best practices:
Lean Six Sigma projects in hospitals led to a 91% reduction in out-of-date stock value and a 45% decrease in nursing stock preparation time. Nurses gained more time for patient care.
Surgical case preparation time dropped by 55%. Non-value-added nursing activities decreased by 95 minutes per shift.
Process redesign increased Basic Life Support training capacity by 50%.
Staff retention after Lean Six Sigma training reached 78%, supporting workforce stability.
Organizations reinvested cost savings from process improvements into further training. This cycle supports ongoing improvement.
System-wide education and shared vision help sustain improvements across all staff levels.
Linking process improvements to strategic goals ensures that outcomes inform future projects.
Improvement Area | Measurable Result |
|---|---|
Stock Management | 91% reduction in out-of-date stock |
Nursing Preparation | 45% time reduction |
Surgical Prep | 55% time reduction |
Training Capacity | 50% increase |
Staff Retention | 78% after training |
HR analytics show that focusing on six key employee engagement drivers increased customer satisfaction by 16%, added 18,000 customers annually, and reduced staff turnover by 10%.
Data dashboards empowered 3,500 users to make faster decisions, freeing HR partners for strategic work.
Predictive analytics identified attrition risks and key talent, supporting workforce planning.
These lessons demonstrate that quantifying improvements, linking actions to business goals, and investing in culture and education are essential for sustained process improvement.
Continuous improvement transforms business performance through clear steps and measurable results. Teams map processes, set goals, analyze data, and monitor progress. Companies see real gains:
Improvement Area | Numerical Summary | Impact Description |
|---|---|---|
Emergency Room Wait Times | 28% reduction | Faster care and better efficiency |
Scrap Reduction | 35% reduction | Less waste and higher product quality |
Customer Complaints | 50% reduction | Stronger satisfaction and consistency |
Overall Yield Increase | 15% increase | Greater cost savings and operational gains |
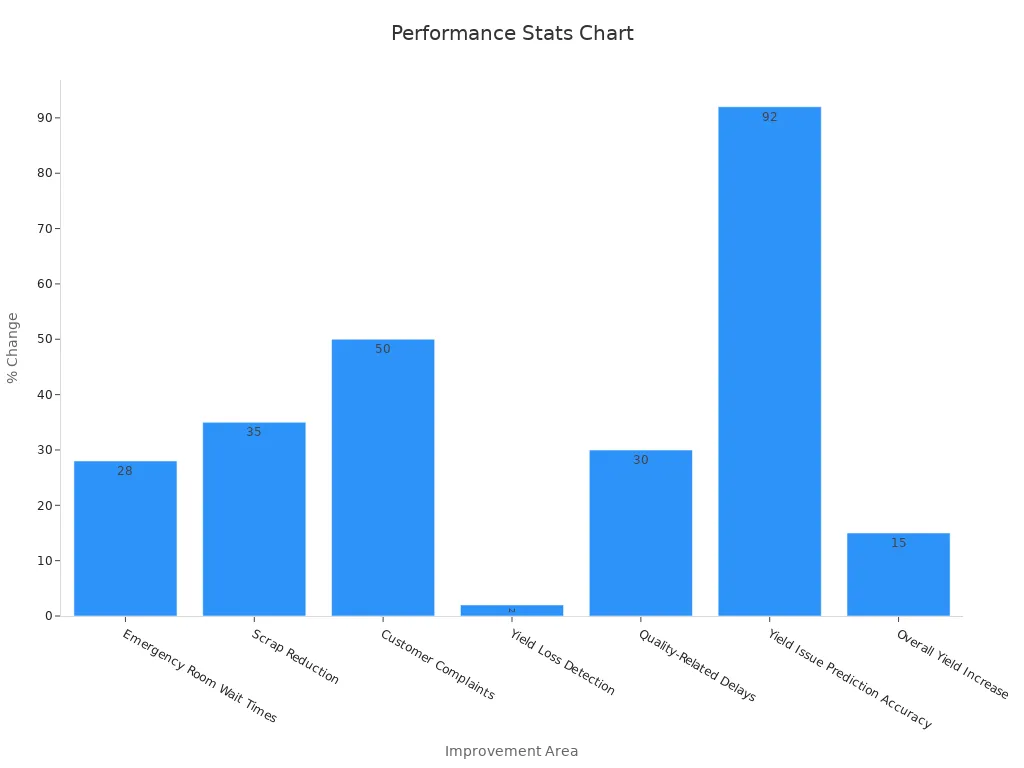
Ongoing adaptation leads to lasting success. Every organization can start this journey and achieve meaningful change.
FAQ
What is the first step in starting continuous improvement?
Teams usually begin by mapping current processes. This step helps everyone see how work flows and where problems exist. Clear process maps make it easier to spot waste and set improvement goals.
How often should teams review business processes?
Most organizations review processes every quarter. Regular reviews help teams catch problems early. Frequent checks also keep improvements on track and support long-term success.
Can small businesses use continuous improvement methods?
Yes. Small businesses can use simple tools like checklists and feedback forms. They do not need complex systems. Even small changes can lead to big gains in efficiency and quality.
What role does leadership play in process improvement?
Leaders set the vision and support teams. They provide resources, encourage feedback, and celebrate progress. Strong leadership keeps everyone focused on improvement goals.
How does automation help with continuous improvement?
Automation handles repetitive tasks. This frees employees to focus on higher-value work. Automated systems also collect data, which helps teams measure results and find new ways to improve.
What are common mistakes to avoid during process improvement?
Teams sometimes skip data analysis or ignore employee feedback. Others try to change too much at once. Successful teams set clear goals, use data, and make small, steady changes.


