A Beginner’s Approach to Lean Six Sigma Process Mapping
Lean Six Sigma Process Mapping gives teams a clear way to see how work flows. Clients and customers benefit when companies use this method to find gaps and remove waste. People new to process mapping learn to spot steps that slow down progress. They build confidence as they tackle optimization steps. Anyone can master this skill with practice and guidance.
Key Takeaways
Lean Six Sigma Process Mapping helps teams visualize workflows, making it easier to identify waste and inefficiencies.
Using process maps, teams can clarify roles and responsibilities, enhancing communication and collaboration.
Start with simple maps like SIPOC diagrams to gain a high-level overview before diving into detailed flowcharts.
Regularly review and update process maps to keep them accurate and relevant as business operations change.
Involve stakeholders in the mapping process to ensure comprehensive understanding and buy-in for improvements.
Set clear goals before mapping to guide the process and measure success effectively.
Testing and validating process maps with real scenarios helps identify gaps and improve accuracy.
Celebrate small wins during the mapping process to build confidence and encourage a culture of continuous improvement.
Lean Six Sigma Process Mapping Overview

What Is Process Mapping
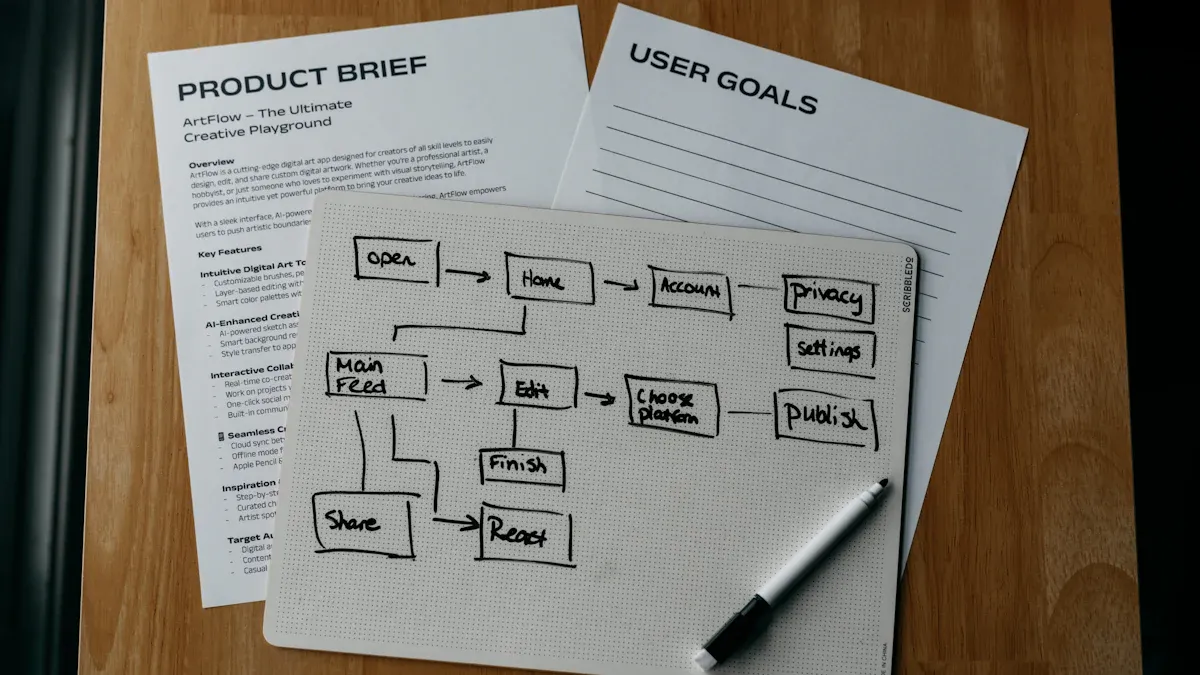
Process mapping shows each step in a workflow using a visual diagram. In Lean Six Sigma, teams use process mapping to understand how work moves from start to finish. This method helps everyone see the process clearly. Teams often begin with process mapping during the Define and Measure phases of the DMAIC methodology. By drawing out each action, they can spot where problems or delays occur. Process mapping acts as a guide for improvement and helps teams communicate more effectively.
Tip: A process map can be as simple as a flowchart or as detailed as a value stream map. The goal is to make the process easy to follow and analyze.
Why It Matters
Process mapping plays a key role in Lean Six Sigma projects. It helps teams visualize every step, making it easier to find waste and inefficiencies. When teams map out a process, they can quickly identify steps that do not add value. This clarity allows them to focus on areas that need improvement. Process mapping also supports the DMAIC framework by providing a visual tool at each stage.
Evidence Description | Key Points |
|---|---|
Process mapping helps teams visualize each step. | Easier to spot problems, reduce waste, and track improvements during Lean Six Sigma projects. |
Mapping process flows allows practitioners to pinpoint non-value-added activities. | Develop strategies for waste elimination, optimizing productivity and cycle time. |
Teams using process mapping see measurable improvements in efficiency and quality. | Helps organizations stay competitive and deliver more value to customers. |
The main purpose of process mapping is to clarify business processes. | Clarity helps teams spot problems, improve quality, and reduce waste. |
Supports the DMAIC methodology by providing visual tools at each stage. | Essential for the structured approach in Lean Six Sigma projects. |
Key Benefits
Lean Six Sigma Process Mapping offers several important benefits for organizations and teams:
Identifies defects, redundancy, and waste in operations.
Streamlines operations and improves processes.
Facilitates collaboration among team members.
Organizations that use Lean Six Sigma Process Mapping often report measurable gains. These include cost reduction, increased revenue, and higher profitability. Teams also see boosts in efficiency and quality. Employee engagement rises as team members take part in process improvement.
Benefit Type | Description |
|---|---|
Cost Reduction | Significant reduction in operational costs by eliminating waste and inefficiencies. |
Revenue Increase | Improved quality and customer satisfaction leading to increased sales and market share. |
Profitability | Higher profitability driven by the combined impact of cost reduction and revenue growth. |
Efficiency Boost | Streamlined processes and reduced cycle times enhance overall efficiency and productivity. |
Quality Improvement | Reduction in defects enhances product or service quality, meeting customer needs effectively. |
Employee Engagement | Involvement in process enhancement boosts morale and fosters a data-driven culture. |
Lean Six Sigma Process Mapping uses several main components to guide improvement:
Measure: Gather data on current performance.
Analyze: Identify root causes of defects and delays.
Improve: Implement solutions to address issues.
Control: Establish measures to ensure sustainability of improvements.
These steps help teams create lasting changes and maintain high standards.
Process Mapping in Lean Six Sigma Projects
DMAIC Phases
Process mapping plays a vital role in every phase of the DMAIC cycle. Teams use it to create a clear picture of how work happens. In the Define phase, they build the project charter, write problem and goal statements, and set project boundaries. They also gather Voice of the Customer (VOC) insights and often start with a high-level process map, such as a SIPOC diagram. This visual tool helps everyone understand the process from start to finish.
Process mapping continues to support the team in later phases. During Measure, teams use maps to set performance baselines. In Analyze, they look for inefficiencies and areas that need improvement. The Improve phase uses process maps to show changes and test new ideas. In Control, teams monitor the process to make sure improvements last.
Phase | Contribution of Process Mapping |
|---|---|
Define | |
Measure | Establishes baselines for performance. |
Analyze | Identifies inefficiencies and areas for improvement. |
Improve | Visualizes changes and improvements in the process. |
Control | Monitors process performance over time. |
Triaging Improvements
Process mapping acts as a roadmap for Lean Six Sigma projects. Teams use it to see where problems exist and decide which issues to fix first. By breaking down each step, they can spot waste, delays, or extra work that does not add value. This method helps teams focus their efforts on the most important changes.
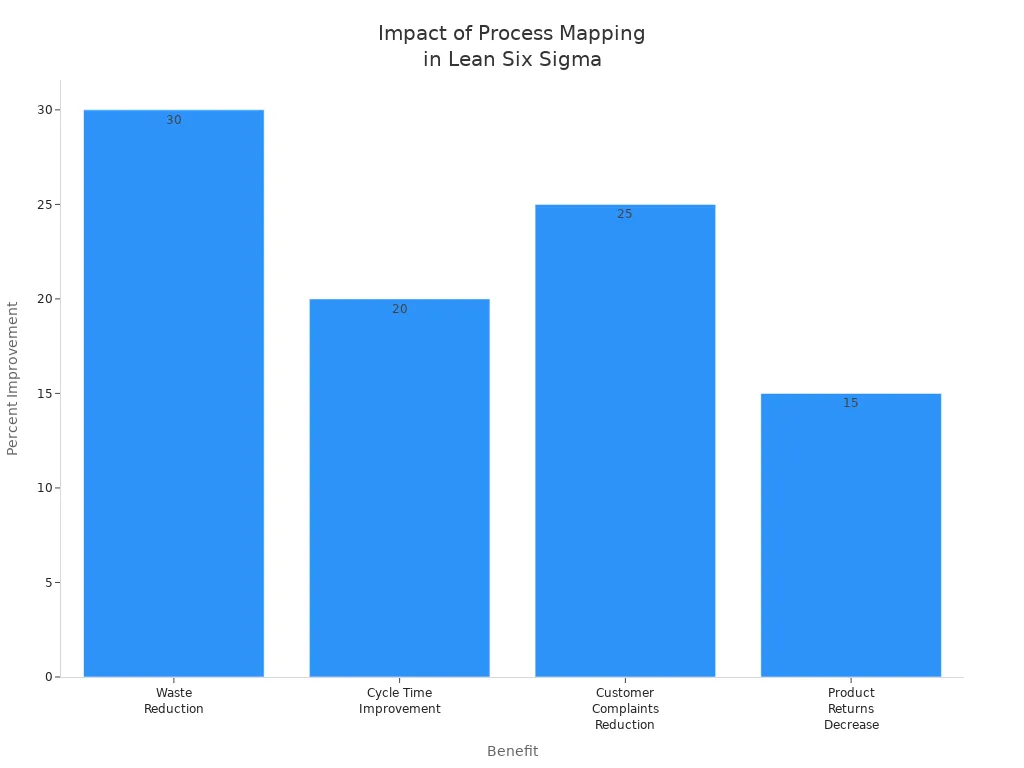
Teams often see big results when they use process mapping to prioritize improvements. For example, they may reduce waste by 30%, improve cycle time by 20%, lower customer complaints by 25%, and decrease product returns by 15%.
Benefit | Quantified Impact |
|---|---|
Waste Reduction | 30% reduction |
Cycle Time Improvement | 20% improvement |
Customer Complaints Reduction | 25% reduction |
Product Returns Decrease | 15% decrease |
Teams also find that process mapping enhances understanding, supports data-driven decisions, and aligns workflows with company goals.
Visualizing Inputs and Outputs
Visualizing inputs and outputs with process maps helps teams break down complex business processes into simple steps. This approach makes it easier to spot bottlenecks and inefficiencies. Process maps show how work flows from one task to another and how different departments connect.
By using process maps, teams gain a clear view of how inputs turn into outputs. This clarity improves communication and decision-making. Teams can measure progress and track changes over time. Regular reviews of process maps help teams find new sources of waste and keep improving.
Process maps guide improvement efforts and help teams stay focused on their goals. They make Lean Six Sigma Process Mapping a powerful tool for lasting change.
Types of Lean Six Sigma Process Maps
Flowchart
Structure
A flowchart uses shapes and arrows to show how a process works. Each box represents a step, and arrows connect the steps in order. Teams often use rectangles for actions, diamonds for decisions, and ovals for start or end points. This simple structure helps everyone understand the process quickly.
Feature | Description |
|---|---|
Graphic Display | Flowcharts visually represent the steps, events, and operations in a process. |
Step-by-Step Illustration | They provide a detailed view of the process 'as-is', capturing inputs, outputs, and steps. |
Team Collaboration | Flowchart creation involves contributions from all individuals associated with the process. |
Identification of Issues | They help in pinpointing bottlenecks or defects in the process flow. |
Usage
Teams use flowcharts to document processes, find problems, and improve workflows. Flowcharts make it easier to spot bottlenecks or defects. They also enhance comprehension and support team collaboration. Many industries rely on flowcharts because they provide a clear view of how work should happen.
Flowcharts help teams visualize steps and make improvements. They support Lean Six Sigma Process Mapping by showing where waste occurs.
Value Stream Map
Elements
A value stream map (VSM) gives a broad view of how value moves through a process. It shows every step from start to finish, including information and material flow. Teams use VSMs to analyze waste and prioritize improvement opportunities. The map includes icons for suppliers, customers, inventory, and data points.
Feature | Value Stream Mapping (VSM) | Process Mapping |
|---|---|---|
Scope of Analysis | Narrow, focusing on a single process | |
Purpose | Identify value creation and waste | Improve efficiency of a specific workflow |
Data Intensity | Heavily relies on quantitative data | Mostly qualitative, with some quantitative |
Outcome | Creates current-state and future-state maps | Delivers a clear representation of work |
Level of Detail | High-level view of key stages | Detailed, step-by-step visualization |
Beginner Tips
Beginners should start with a simple value stream map. They can use basic shapes and arrows to show how materials and information flow. Teams should focus on identifying steps that add value and those that do not. It helps to gather data about cycle times, inventory, and delays. Keeping the map clear and uncluttered makes it easier to analyze and improve.
SIPOC Diagram
Components
A SIPOC diagram summarizes a process at a high level. It stands for Suppliers, Inputs, Process, Outputs, and Customers. Each component plays a role in process improvement.
Component | Description |
|---|---|
Suppliers | Individuals or entities providing necessary inputs for the process, crucial for quality and availability. |
Inputs | Materials, resources, or information required for the process, directly influencing output quality. |
Process | The series of steps transforming inputs into outputs, essential for identifying improvement areas. |
Outputs | End products or services generated, ensuring alignment with customer requirements. |
Customers | Individuals or entities benefiting from the outputs, ensuring the process delivers value. |
Uses
Teams use SIPOC diagrams to define project boundaries and clarify who supplies inputs and who receives outputs. This tool helps everyone understand the big picture before diving into details. SIPOC diagrams support process improvement by highlighting key relationships and ensuring alignment with customer needs.
SIPOC diagrams provide a foundation for mapping and improving processes. They help teams focus on what matters most.
Most Common Types in Practice
Simple-drawing maps use boxes and arrows for basic steps.
SIPOC maps summarize the process at a high level.
Flowcharts show detailed steps and decisions.
Flow process charts identify non-value-added activities.
Value stream maps analyze waste and prioritize improvements.
Block diagrams represent high-level processes.
Swim lane maps organize steps by function.
Cross resource maps show resource-to-resource connections.
Swimlane Diagram
Roles
A swimlane diagram organizes process steps into lanes. Each lane represents a person, team, or department. This structure helps everyone see who handles each task. Swimlane diagrams clarify roles and responsibilities in Lean Six Sigma projects. Teams use these diagrams to reduce confusion and improve accountability.
Swimlane diagrams distinctly show who is responsible for each step in a process, which reduces confusion and enhances accountability.
They illustrate interactions between different functional areas, thereby promoting improved cross-functional collaboration.
For example, a swimlane diagram might show how a customer order moves from sales to shipping. Each lane displays the tasks for each department. This visual layout makes it easy to spot handoffs and gaps. Teams can see where delays happen and who needs to take action. Swimlane diagrams help teams work together and understand their roles.
Swimlane diagrams promote teamwork and clear communication. They make it easier for everyone to follow the process and know their responsibilities.
Common Mistakes
Teams sometimes make mistakes when creating swimlane diagrams. One common error is not defining lanes clearly. If lanes overlap or lack labels, people may get confused about their tasks. Another mistake is adding too many steps or lanes. This can make the diagram hard to read and understand.
Some teams forget to update swimlane diagrams when processes change. Outdated diagrams can lead to misunderstandings and missed steps. Teams should review and revise diagrams regularly. They should also involve all stakeholders when mapping roles. This ensures accuracy and helps everyone stay informed.
Mistake | Impact |
|---|---|
Unclear lane labels | Causes confusion about responsibilities |
Too many lanes | Makes diagrams complex and hard to follow |
Outdated diagrams | Leads to errors and missed tasks |
Lack of stakeholder input | Reduces accuracy and buy-in |
Teams should keep swimlane diagrams simple and up-to-date. Clear labels and regular reviews help avoid common mistakes.
Process Map Hierarchy
L1-L4 Levels
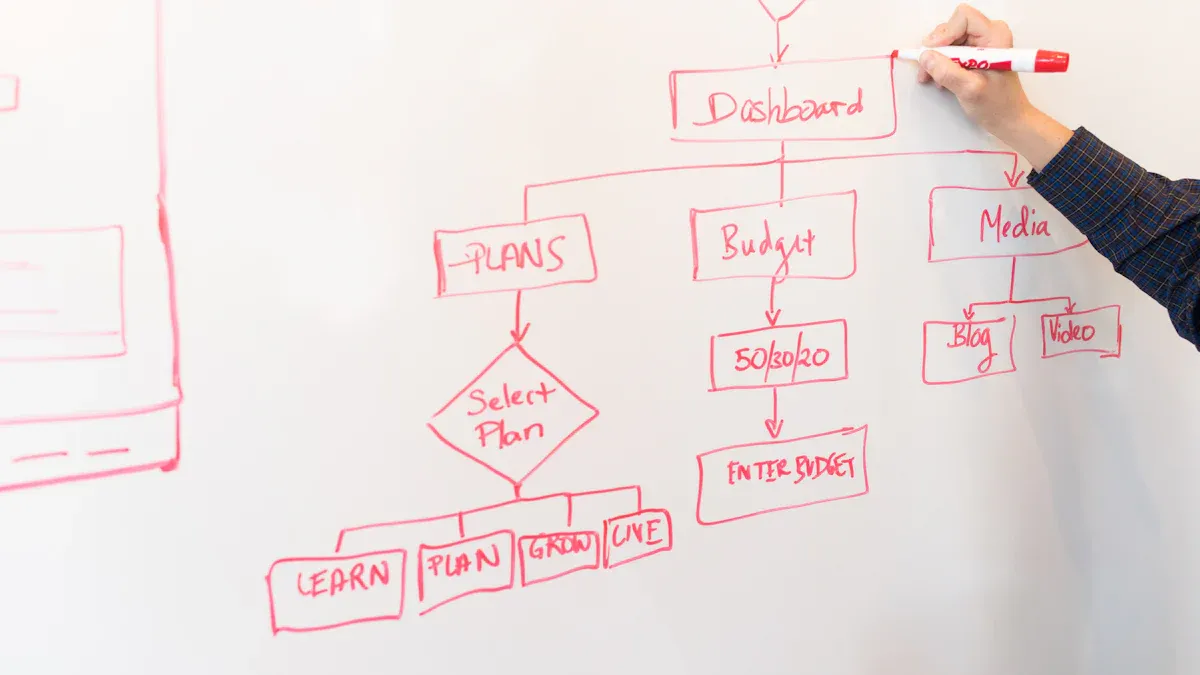
Process map hierarchy helps teams analyze processes at different levels of detail. Lean Six Sigma projects often use a top-down approach. Teams start with a broad overview and then break the process into smaller parts. This method uses levels, usually labeled L1 to L4.
Identification of improvement opportunities
Improved communication between stakeholders
Documentation of a process
At Level 1 (L1), teams create a high-level map. This shows the main steps and flow of the process. Level 2 (L2) adds more detail, breaking each main step into sub-steps. Level 3 (L3) focuses on specific tasks within each sub-step. Level 4 (L4) provides the most detail, showing exact actions and data points.
The hierarchical approach in process mapping, such as the Top-Down Map, allows teams to begin with a broad overview and progressively delve into more detailed levels. This method helps in identifying constraints, data collection points, and opportunities for improvement, thereby facilitating effective process analysis in Lean Six Sigma.
Teams use process map hierarchy to find constraints and collect data. They can spot improvement opportunities at each level. This approach improves communication between stakeholders. It also helps teams document processes clearly and thoroughly.
Process map hierarchy guides teams from big-picture thinking to detailed analysis. It supports Lean Six Sigma goals by making processes easier to understand and improve.
Process Mapping Steps
Define Goals
Teams begin Lean Six Sigma Process Mapping by setting clear goals. They identify the problem and decide what they want to improve. Goals help everyone stay focused and understand the purpose of the project. Teams write down objectives, such as reducing waste or improving quality. They make sure goals are specific and measurable. A well-defined goal guides the mapping process and keeps the team aligned.
Setting clear goals gives direction and helps teams measure success.
Identify Steps
After defining goals, teams list each step in the process. They break down the workflow into simple actions. This approach makes it easier to see how work moves from start to finish. Teams often use brainstorming sessions or interviews to gather information. They ask questions like, "What happens first?" and "Who does each task?" Teams document every action, decision, and handoff.
Effective methods for identifying process steps include:
Collecting relevant data about the process.
Analyzing data to find root causes.
Developing and implementing solutions.
Maintaining and monitoring improvements.
Teams use these methods to ensure they capture all important steps. They create a list or diagram that shows the sequence of actions. This list forms the foundation for the process map.
Phase | Description |
|---|---|
Define | Articulate the problem, identify project scope, and create a high-level process map. |
Measure | Establish baseline data, select metrics, and map detailed process steps. |
Analyze | Identify root causes using statistical tools and data analysis. |
Improve | Develop and test solutions based on identified root causes. |
Control | Ensure improvements are sustained through monitoring and standardization of processes. |
Choose Map Type
Teams select the map type that fits their project needs. Beginners often start with SIPOC diagrams. These diagrams provide a broad overview and help teams see relationships between suppliers, inputs, processes, outputs, and customers. SIPOC diagrams make it easier to begin mapping without too much detail.
Teams may choose flowcharts for step-by-step visualization or value stream maps for analyzing waste. Swimlane diagrams work well when roles and responsibilities need clarification. The choice depends on the complexity of the process and the team's goals.
Choosing the right map type helps teams visualize the process and focus on improvement.
Lean Six Sigma Process Mapping starts with clear goals, detailed steps, and the right map type. These actions lay the groundwork for successful process improvement.
Document Process
Teams document the process by creating a clear and accurate map. They use symbols, arrows, and labels to show each step. The process map should match the goals set at the beginning. Teams include enough detail to guide users but avoid making the map too complex. They use standard symbols and consistent notation so everyone understands the map.
A well-documented process map helps teams see how work flows and where problems might occur. Teams involve people who know the process best. These stakeholders help make sure the map is correct and complete. For large or complicated workflows, teams break the process into smaller sections. This makes each part easier to understand.
Best practices for documenting processes include:
Best Practice | Description |
|---|---|
Clear Scope | Define what the process map covers to align with business goals. |
Balanced Detail | Include enough detail to guide users but avoid overwhelming them. |
Consistent Symbols and Notation | Use the same symbols and notation throughout the map to prevent confusion. |
Stakeholder Engagement | Involve people who work with the process for accurate mapping. |
Divide Complex Processes | Break large workflows into smaller maps for clarity. |
Regular Reviews and Updates | Review and update process maps often to keep them current. |
Testing and Validation | Test the process map with real scenarios to find gaps or errors. |
Continuous Feedback | Gather feedback to make sure the map stays useful and effective. |
Teams should review and update process maps as business operations change. This keeps the maps relevant and helpful.
Gather Feedback
Teams gather feedback to improve the process map and make sure it works well for everyone. They ask people who use or manage the process to share their thoughts. Feedback helps teams find missing steps, unclear instructions, or confusing symbols.
Common ways to gather feedback include:
Surveys: Teams create surveys for clients or users to rate the process.
Feedback forms: They use forms on websites or in meetings to collect suggestions.
Social media: Teams listen to comments and questions on platforms like Twitter or Facebook.
Review sites: They monitor reviews on trusted sites to learn about user experiences.
Customer interviews: Teams talk with customers or users to get detailed opinions.
Email: They send follow-up emails to ask for feedback after someone uses the process.
Teams use feedback to make the process map clearer and more effective. They involve users early and often to catch problems before they grow.
Test and Validate
Testing and validating the process map ensures it matches real-world actions. Teams run through the process step by step to check for errors or missing parts. They use several techniques to make sure the map is accurate and useful.
Teams hold collaborative mapping sessions. Everyone shares information and checks the map together.
They identify key data points, such as how long each step takes or where delays happen.
Teams capture exceptions, noting any unusual cases or problems that might occur.
They write down improvement ideas separately. This keeps the focus on understanding the current process before making changes.
A second facilitator can help guide the session, especially for complex processes.
Teams assign action items at the end. Each person knows what to check or improve next.
Testing and validation help teams build confidence in their process maps. Accurate maps lead to better decisions and lasting improvements.
Reviewing Your Map
Common Pitfalls
Many teams face challenges when reviewing Lean Six Sigma process maps. These pitfalls can slow progress and reduce the effectiveness of improvement efforts. Teams should watch for these common mistakes:
Not numbering or labeling process steps.
Omitting who completes each step and where it happens.
Combining multiple steps into one, often using "AND" instead of separating actions.
Relying on what a manager says instead of observing the actual process.
Creating overly complicated maps that are hard to understand.
Using too many images, colors, or symbols that do not add value.
Failing to define the scope and purpose of the process map.
Leaving out important stakeholders during mapping.
Ignoring sub-processes that affect the main workflow.
Using only flowcharts for complex processes when other map types may work better.
Making swimlane diagrams without clear roles.
Teams that avoid these pitfalls create maps that are clear, accurate, and useful for improvement.
Team Involvement
Involving people from different parts of the organization strengthens process mapping. When systems and teams work together, they gain a deeper understanding of how work happens. This approach uncovers hidden issues and leads to better results. Clients who use cross-functional teams often see more accurate maps and faster improvements.
Evidence Description | Reasoning |
|---|---|
Teams that involve members from across the organization gain a deeper understanding of the process and uncover hidden issues. | This highlights how team involvement leads to a more comprehensive view of the process, improving accuracy. |
Regular reviews and feedback sessions help ensure the map reflects reality. | This emphasizes the importance of continuous improvement and validation of the process maps. |
Open communication builds trust and encourages people to share their ideas. | This indicates that a collaborative environment fosters innovation and problem-solving. |
Systems and teams that include everyone in the mapping process achieve better alignment with business goals. They also build trust and encourage open communication. Regular reviews help keep the process map up to date and relevant.
Using Feedback
Feedback plays a key role in refining process maps. Teams that gather input from users and stakeholders make their maps more effective. Early engagement helps align the map with project goals. Ongoing feedback allows for continuous improvement.
Strategy | Description |
|---|---|
Involving stakeholders in the validation process promotes collaboration and alignment with goals. | |
Implement Feedback Loops | Establishing mechanisms for ongoing feedback enables continuous adjustments based on team input. |
Teams that use feedback loops can adjust their maps as processes change. This practice ensures the map stays accurate and valuable.
Clients at systems and teams who follow these strategies see better results from Lean Six Sigma process mapping. They create maps that reflect real work, support improvement, and drive lasting change.
Getting Started with Lean Six Sigma Process Mapping
First Steps
Many teams feel unsure when they begin Lean Six Sigma Process Mapping. Taking the first steps can make the process easier and more approachable. Beginners can follow a simple path to get started:
Identify each step in the process through brainstorming sessions.
Sequence the actions logically to ensure a clear flow.
Document the process thoroughly to create a lasting record.
These steps help teams build a strong foundation. Defining the scope keeps the project focused. Brainstorming uncovers every action, while sequencing ensures the process makes sense. Documenting the process creates a reference for everyone involved.
Tip: Teams should keep their first process maps simple. Starting with a basic outline helps everyone understand the workflow before adding more detail.
Building Confidence
Confidence grows as teams practice and learn new skills. Teams that train regularly master process mapping techniques faster. They also feel more comfortable sharing ideas and making improvements. Measuring success motivates everyone to keep learning and improving.
Continuous training helps teams master process mapping techniques, which builds confidence and accelerates learning.
Teams that measure success build confidence and motivate everyone to keep improving, supported by Lean Six Sigma Process Mapping.
Teams can celebrate small wins to boost morale. Sharing progress with others encourages a culture of improvement. Over time, confidence leads to better results and more effective process maps.
Note: Teams should not worry about making mistakes. Every process map is a chance to learn and grow.
Further Learning
Teams that want to deepen their knowledge can explore many learning resources. Different training types and tools help teams improve their skills and stay updated.
Training Type | Description |
|---|---|
Workshops | Interactive sessions for skill-building |
Online Courses | Flexible learning for all employees |
Peer Review | Sharing feedback and insights |
Hands-on practice with real processes helps teams apply what they learn. Digital mapping tools with drag-and-drop features make collaboration easier and updates faster. Regular expert feedback guides teams in the right direction. Learning from successful projects gives teams practical examples to follow.
Teams should involve the right people, keep maps simple, use standard symbols, and focus on value-adding activities. These strategies help create accurate and effective process maps.
For those interested in learning more or seeking support, reaching out to experienced practitioners or training providers can provide valuable guidance and resources.
Lean Six Sigma Process Mapping offers organizations clear advantages. Teams see better results when they use this method to improve how work gets done.
Benefit | Description |
|---|---|
Streamlined workflows and less waste lower costs. | |
Improved Quality and Reliability | Consistent processes reduce errors and build trust. |
Enhanced Customer Satisfaction | Better quality leads to happier, more loyal customers. |
Promoting Innovation and Excellence | A culture of improvement encourages new ideas and teamwork. |
Teams can start by mapping simple processes. They will find waste, improve quality, and build confidence as they practice.
Standardization helps every team member follow the best steps. This makes work more reliable and efficient.
Anyone can learn Lean Six Sigma Process Mapping. Taking the first step today can lead to lasting improvements.
FAQ
What is Lean Six Sigma Process Mapping?
Lean Six Sigma Process Mapping shows each step in a workflow. Teams use it to visualize processes, identify waste, and improve efficiency. This method helps organizations understand how work happens and where improvements can be made.
Which process map should a beginner use first?
Beginners often start with a SIPOC diagram. This map provides a high-level overview and helps teams see relationships between suppliers, inputs, processes, outputs, and customers. Flowcharts are also easy for beginners to create and understand.
How does process mapping help reduce waste?
Process mapping allows teams to spot steps that do not add value. By visualizing the workflow, teams identify bottlenecks, redundancies, and delays. Removing these issues leads to less waste and improved productivity.
Can process mapping improve team communication?
Yes. Process mapping creates a shared visual reference. Teams use maps to clarify roles, responsibilities, and handoffs. This improves collaboration and reduces misunderstandings.
What symbols are commonly used in process maps?
Teams use rectangles for actions, diamonds for decisions, and ovals for start or end points. Arrows show the direction of workflow. Standard symbols make maps easier to read and understand.
How often should teams update process maps?
Teams should review and update process maps regularly. Changes in business operations, roles, or technology require updates. Keeping maps current ensures accuracy and supports continuous improvement.
Is software required for process mapping?
Software helps teams create, edit, and share process maps. Many teams use digital tools for collaboration. However, teams can also use paper, whiteboards, or simple drawing tools for basic maps.
What mistakes should teams avoid when mapping processes?
Teams should avoid unclear labels, combining steps, and leaving out stakeholders. Overly complex maps and outdated diagrams cause confusion. Regular reviews and clear documentation help prevent these mistakes.


