How Lean Six Sigma Process Mapping Improves Efficiency
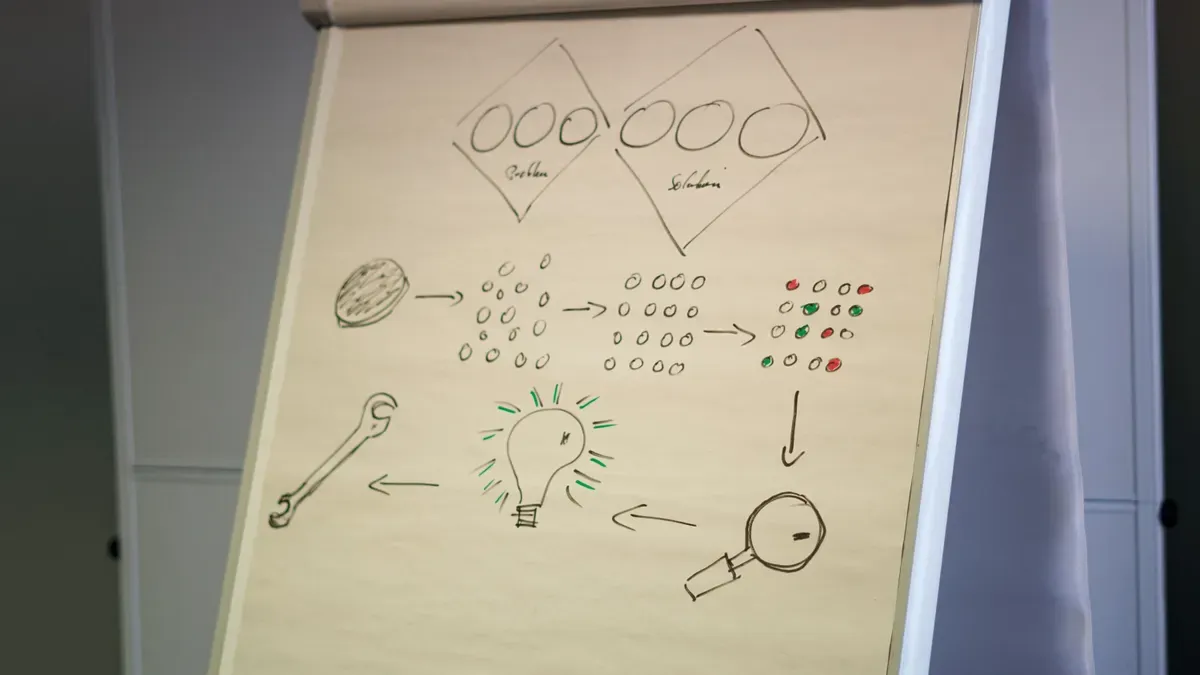
Lean Six Sigma Process Mapping gives teams a clear picture of how work moves from start to finish. By laying out each step, teams can spot where delays and extra tasks slow down progress. Many organizations see dramatic improvements after using these Optimization Steps. For example, some report up to 70% faster production cycle times and 50% lower manufacturing costs.
Metric | Improvement Percentage |
|---|---|
Production Cycle Times | Up to 70% |
Manufacturing Costs | 50% |
Clients and customers both benefit from smoother, more efficient processes. Teams that map their work gain transparency and create a strong base for ongoing improvement.
Key Takeaways
Lean Six Sigma Process Mapping helps teams visualize workflows, making it easier to identify inefficiencies and delays.
Using process maps can lead to significant improvements, such as up to 70% faster production cycles and 50% lower costs.
Engaging stakeholders early in the mapping process ensures that the final maps reflect real-world practices and needs.
Regularly updating process maps keeps them relevant and effective, allowing teams to adapt to changes in workflows.
Visual tools like SIPOC diagrams and flowcharts simplify complex processes, making it easier to spot areas for improvement.
Collaboration among team members enhances the accuracy of process maps and fosters a culture of continuous improvement.
Data-driven analysis of mapped processes helps teams prioritize which inefficiencies to address first for maximum impact.
Focusing on efficiency not only improves internal processes but also enhances customer satisfaction and product quality.
Process Mapping In Lean Six Sigma
What Is Process Mapping
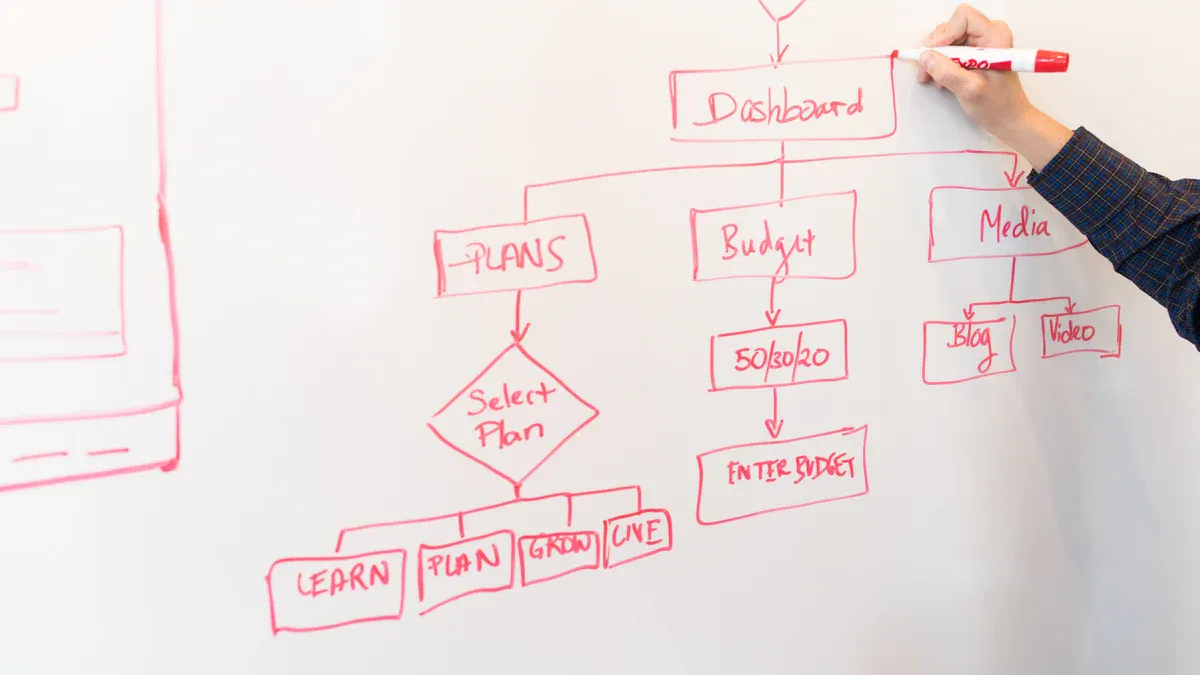
Process mapping creates a visual guide for how work flows in an organization. It shows each step, decision point, and the order of activities. Teams use process maps to see how tasks connect and where hand-offs happen. This method helps everyone understand the process from start to finish.
A process map often includes several main components. The table below outlines these elements:
Component/Type | Description |
|---|---|
Process Steps | Tasks or activities that convert inputs into outputs. |
Decision Points | Points where decisions influence subsequent steps. |
Inputs and Outputs | Resources needed for tasks and the results of those tasks. |
Flow of Processes | Direction and sequence of the process steps. |
SIPOC Map | Breaks down the process into Suppliers, Inputs, Process, Outputs, Customers. |
High Level Map | Shows main steps without too much detail for overall understanding. |
Detailed Map | Explains every step to identify specific problems. |
Swimlane Map | Divides the process by department or team to show roles and bottlenecks. |
Value Stream Map | Focuses on value-adding and non-value-adding steps to eliminate waste. |
Spaghetti Diagram | Illustrates physical movement to identify layout inefficiencies. |
Current State Map | Shows how the process works now. |
Future State Map | Illustrates how the process should work after improvements. |
Process Mapping’s Role In Lean Six Sigma
Lean Six Sigma Process Mapping acts as a foundation for improvement projects. Teams use it to gain a clear understanding of how a process works. This visual tool highlights activities, sequences, and hand-offs between people or departments. It also defines the boundaries of each operation, which helps teams see where one group’s work ends and another’s begins.
Process mapping helps teams identify inefficiencies and areas for improvement. It allows them to see the current state of processes, which is essential for solving problems. In Lean Six Sigma, the 'measure' phase relies on process mapping to set clear baselines. This step-by-step overview of inputs, actions, and outputs is crucial for comparing performance and finding gaps.
Why Efficiency Matters
Efficiency means doing more with less effort, time, or resources. In business, efficient processes lead to faster results, lower costs, and better quality. Lean Six Sigma Process Mapping helps teams find delays, extra steps, or confusion in their workflows. By making these issues visible, teams can remove waste and improve productivity.
When teams improve efficiency, they deliver better products and services. Customers receive faster responses and higher quality. Organizations also save money and use resources more wisely. For these reasons, efficiency stands at the heart of Lean Six Sigma projects.
Identifying Waste And Inefficiency

Visualizing Current Workflows
Teams often struggle to see the full picture of their business processes. Visualizing current workflows gives everyone a clear view of how work moves from start to finish. This approach helps each department understand its role in reaching company goals. When teams map out their processes, they can spot hidden waste and areas that need improvement.
Visualizing workflows provides clarity and a shared reference point for team members. It helps identify inefficiencies and bottlenecks that may not be visible in traditional documentation. Streamlined communication reduces redundancies and fosters collaboration across departments.
To uncover hidden waste, organizations can follow these steps:
Begin with stakeholder conversations to learn about frustrations and inefficiencies.
Review existing documentation to find gaps between planned and actual processes.
Map the current-state process using visual tools like BPMN.
Identify pain points with data to confirm which issues matter most.
Validate findings with teams to ensure accuracy.
Use BPMN to redesign the future state and remove inefficiencies.
Finding Bottlenecks And Redundancies
Bottlenecks and redundancies slow down business processes and waste resources. Lean Six Sigma Process Mapping uses several tools to find these problems. SIPOC diagrams give a high-level overview by showing suppliers, inputs, processes, outputs, and customers. High-level process maps focus on the main steps, while detailed maps capture every action and decision. Swimlane diagrams divide tasks by team or department, making it easier to see who does what. Value stream maps show the entire process and highlight steps that do not add value.
Analyzing inefficiencies and bottlenecks is a critical step. Teams look for slowdowns, extra steps, or tasks that do not add value. Common issues include complex processes, over-engineered workflows, and delays in approvals. The table below lists the most common types of inefficiencies found during process mapping:
Type of Inefficiency | Description |
|---|---|
Defects | Errors or flaws in the process that lead to rework or scrap. |
Redundancy | Unnecessary duplication of tasks or processes that do not add value. |
Waste | Activities that consume resources without adding value. |
Making Data-Driven Improvements
After mapping and analyzing the process, teams use data to guide their improvements. Data analysis helps refine processes by pointing out steps that do not add value. Technology can support this work by providing real-time analytics and automatic updates to process maps. Continuous monitoring ensures that processes stay aligned with business needs.
Teams that build a culture of data-driven improvement work together more effectively. They use facts to make decisions and hold each other accountable for results. By focusing on data, organizations can keep improving their processes and stay competitive.
Lean Six Sigma Process Mapping Steps
Choose The Process
Selecting the right process sets the stage for successful Lean Six Sigma Process Mapping. Teams should focus on processes that impact business goals or customer satisfaction. They often choose processes with frequent errors, delays, or high costs. Leaders look for areas where improvement will deliver the most value.
When choosing a process, teams consider several criteria:
Individuals with detailed knowledge of the process steps help identify the right focus.
Subject matter experts validate the process and ensure accuracy.
Motivated participants contribute energy and time to the project.
Team members with strong relationships across groups support collaboration.
Early engagement of sponsors secures resources and support.
Teams assess readiness and address potential conflicts before mapping sessions.
Tip: Start with a process that has clear boundaries and measurable outcomes. This approach makes it easier to track improvements and demonstrate results.
Build The Team
A strong team brings together the right mix of skills and perspectives. Each member plays a unique role in creating an accurate and useful process map. The table below outlines essential roles and expertise for effective process mapping:
Role/Expertise | Description |
|---|---|
Detailed Knowledge | Individuals who understand the specific steps of the process. |
Subject Matter Experts | Experts who can validate and support the accuracy of the process map. |
Stakeholders | Individuals who can provide support and validation for the mapping efforts. |
Motivated Participants | Team members who have the time and energy to contribute effectively. |
Strong Relationships | Participants with good connections across groups to enhance collaboration. |
Engaged Sponsors | Leaders who can provide necessary resources and support for the initiative. |
Team members work together to gather information, review the process, and suggest improvements. Collaboration ensures that the process map reflects reality and gains support from all involved.
Map The Current State
Mapping the current state gives teams a clear view of how the process works today. This step establishes a baseline for performance and highlights areas for improvement. Teams use visual diagrams such as flowcharts, SIPOC diagrams, value stream maps, and swimlane diagrams to capture each step and decision point.
Best practices for mapping the current state include:
Observing the process in action to understand real workflows.
Collecting data on each step to measure time, cost, and resources.
Comparing the actual process to documented procedures to find gaps.
Using digital tools like Traxion, iGrafX Process, or SigmaFlow for building and analyzing maps.
Asking team members to review the map for accuracy and completeness.
Note: A detailed current-state map helps teams identify pain points and bottlenecks. This foundation supports targeted improvements in later steps.
Analyze For Inefficiency
Teams use Lean Six Sigma Process Mapping to uncover where processes break down or waste resources. This step focuses on finding delays, unnecessary steps, and sources of errors. Teams rely on several analytical tools to make this analysis effective:
Value Stream Mapping helps teams see where time is spent and where value is created. It highlights steps that do not add value and points out bottlenecks.
Pareto Analysis allows teams to focus on the most significant causes of waste or defects. By targeting the biggest problems first, teams can make the largest impact.
SIPOC Diagrams provide a high-level overview of the process. They help teams identify key inputs and outputs before diving into detailed analysis.
Teams often gather data from process maps, interviews, and direct observation. They look for patterns such as repeated tasks, long wait times, or frequent hand-offs. By using these tools, teams can prioritize which inefficiencies to address first. This approach ensures that improvements target the most critical issues and deliver measurable results.
Tip: Teams should involve people who work in the process every day. Their insights help identify hidden problems that may not appear in documentation.
Design The Future State
After identifying inefficiencies, teams design a future state that maximizes efficiency. This step creates a vision for how the process should work after improvements. Teams follow a structured approach to ensure success:
Build awareness and commitment among stakeholders. Educate them about lean principles and secure leadership support. An executive sponsor can champion the initiative.
Assess the current state by evaluating existing practices against lean principles. Identify pain points and measure baseline performance.
Select pilot projects with high visibility and manageable scope. Choose motivated team members and define clear success criteria.
Provide focused training on essential lean tools. Start with value stream mapping and visual management. Offer just-in-time training for immediate application.
Implement core practices such as visual management and daily stand-ups. Map the value stream to find improvement opportunities and use pull systems to control work-in-progress.
Teams use Lean Six Sigma Process Mapping to visualize the new process. They remove unnecessary steps, streamline hand-offs, and ensure each activity adds value. The future state map becomes a guide for implementing changes and tracking progress.
Note: A well-designed future state map helps teams communicate their vision and align everyone toward common goals.
Implement Changes
Implementing process changes brings the future state to life. Teams often face challenges during this phase. Common obstacles include lack of leadership commitment, employee resistance, and inadequate training. Middle managers may feel pressured and see no direct benefit, which can slow progress. Employees may worry about job security or question if changes will last. Without proper training and resources, teams may struggle to adopt new practices.
To overcome these challenges, teams should:
Secure active support from leaders at all levels.
Address employee concerns through clear communication and involvement.
Provide thorough training and allocate necessary resources.
Select projects carefully to avoid scope creep and ensure early wins.
Reinforce new processes with regular reviews and feedback sessions.
Sustaining improvements requires ongoing attention. Teams must monitor results, celebrate successes, and adjust as needed. By following these steps, organizations can ensure that process changes deliver lasting efficiency gains.
Callout: Change is difficult, but with strong leadership and team involvement, organizations can overcome obstacles and achieve continuous improvement.
Types Of Process Maps
SIPOC Diagram
A SIPOC diagram gives teams a high-level overview of a process. SIPOC stands for Suppliers, Inputs, Process, Outputs, and Customers. This tool helps teams define the boundaries of a process before they start making changes. Each column in the diagram answers a key question:
Suppliers: Who provides the inputs?
Inputs: What resources enter the process?
Process: What are the main steps?
Outputs: What results come from the process?
Customers: Who receives the outputs?
Teams use SIPOC diagrams to set clear starting and ending points. This clarity helps everyone understand what the process includes and what it does not. For example, in a machining process, a SIPOC diagram lists the suppliers, the raw materials, the main steps, the finished parts, and the customers who receive them. SIPOC diagrams work well as a first step in Lean Six Sigma projects because they help teams plan improvements and communicate with stakeholders.
Tip: SIPOC diagrams set clear boundaries and make it easier to focus on the right areas for improvement.
Value Stream Map
A Value Stream Map (VSM) shows how materials and information move through a process. Teams use VSMs to find waste and spot steps that do not add value. This map covers the entire process, from the first supplier to the final customer. It includes every action, wait time, and hand-off.
Value Stream Maps help teams see the big picture. They show where delays, extra steps, or bottlenecks slow down the process. For example, in automotive parts manufacturing, a VSM can reveal where materials pile up or where information gets lost. Teams use this map to drive continuous improvement and support lean initiatives.
Type of Process Map | Definition | Purpose | Manufacturing Example | Benefits |
|---|---|---|---|---|
Value Stream Map | Visualizes the flow of materials and information through a production system. | Identify waste in processes. | Maps the supply chain in automotive parts manufacturing. | Provides a holistic view, drives improvement. |
Note: Value Stream Maps help teams focus on removing waste and making the process flow smoothly.
Swimlane Map
A Swimlane Map organizes process steps into lanes based on roles, teams, or departments. Each lane shows who is responsible for each part of the process. This layout makes it easy to see hand-offs and interactions between groups.
Swimlane Maps help teams clarify accountability. They show where delays or confusion happen when work moves from one group to another. For example, in a maintenance process, a Swimlane Map can show how operators report faults and maintenance staff fix them. This tool improves collaboration and reduces delays in complex processes.
Type of Process Map | Definition | Purpose | Manufacturing Example | Benefits |
|---|---|---|---|---|
Swimlane Diagram | Organizes activities into lanes for different roles. | Clarify accountability and team interaction. | Shows operators and maintenance staff roles in repairs. | Improves collaboration, reduces delays. |
Teams often choose Swimlane Maps when they need to improve teamwork and clarify responsibilities.
Flowchart
A flowchart gives a step-by-step visual of a process using shapes and arrows. Each shape stands for a different type of action or decision. Teams use flowcharts to break down complex processes into simple steps. This tool helps everyone see the order of tasks and how decisions lead to different outcomes.
Flowcharts use standard symbols. For example, ovals show the start or end of a process. Rectangles represent actions or tasks. Diamonds indicate decision points. Arrows connect the shapes and show the direction of flow. The table below explains common flowchart symbols:
Symbol | Meaning | Example Use |
|---|---|---|
Oval | Start/End | Beginning or finish of process |
Rectangle | Process/Action | Task like "Check Inventory" |
Diamond | Decision | Yes/No question |
Arrow | Flow Direction | Shows next step |
Teams often use flowcharts for training, troubleshooting, and process improvement. A flowchart can reveal where confusion or errors happen. For example, a team might use a flowchart to map the steps for handling a customer order. If the process has too many decision points, the team can see where delays or mistakes might occur.
Tip: Simple flowcharts work best for processes with clear steps and few branches. For more complex workflows, teams may need detailed maps or swimlane diagrams.
Selecting The Right Map
Choosing the right process map depends on the goal and the complexity of the process. Each type of map has strengths. Teams should match the map to their needs.
SIPOC Diagram: Best for getting a high-level overview and defining process boundaries.
Value Stream Map: Useful for finding waste and improving flow in end-to-end processes.
Swimlane Map: Helps clarify roles and hand-offs between teams or departments.
Flowchart: Ideal for showing step-by-step actions and decisions in a simple process.
Teams can ask these questions to select the right map:
What is the main goal—overview, detail, or role clarity?
How many teams or departments take part in the process?
Does the process have many decision points or branches?
Is the focus on finding waste, clarifying roles, or improving a specific step?
Note: Teams may use more than one type of map during a Lean Six Sigma project. Starting with a SIPOC diagram gives a broad view. Later, a flowchart or swimlane map can add detail.
Selecting the right map helps teams see problems clearly and choose the best solutions. The right visual tool makes process improvement easier and more effective.
Real-World Efficiency Gains
Lean Six Sigma Process Mapping has helped many organizations achieve measurable improvements in efficiency. By using process maps, teams can see where problems exist and make changes that lead to real results. The following examples show how different industries have used this approach to boost productivity and reduce waste.
Manufacturing Example
Manufacturing companies often face challenges with waste, slow cycle times, and limited capacity. Teams use process mapping to find and remove steps that do not add value. This method helps them focus on activities that improve output and quality. The table below shows common efficiency gains in manufacturing after applying process mapping:
Efficiency Gain | Description |
|---|---|
Waste Reduction | Redirects resources to value-creating activities |
Cycle Time Improvements | Streamlines workflows for faster processing |
Capacity Optimization | Increases output without additional resource investment |
Productivity Increases | Measured through output per input ratios |
For example, a factory that mapped its assembly line found several steps where materials waited for long periods. By removing these delays, the team reduced cycle times and increased daily output. Teams also used process maps to balance workloads, which led to better use of machines and workers.
Service Example
Service organizations, such as call centers and logistics companies, use process mapping to improve delivery times and customer satisfaction. Teams often discover that some steps cause long wait times or repeated work. By streamlining these steps, they can serve more customers in less time. The table below highlights improvements seen in service settings:
Metric | Before Lean Six Sigma | After Lean Six Sigma | Improvement |
|---|---|---|---|
Average wait time | 1.8 hours | 57% | |
Satisfaction scores | N/A | 85th percentile | N/A |
Daily patient throughput | N/A | 25% increase | N/A |
Staff utilization rates | N/A | 15% improvement | N/A |
A logistics team mapped its order fulfillment process and found that orders often waited for approval. By changing the approval step, the team cut lead times in half, from 14 days to 7 days. This change also improved customer satisfaction and made it easier to handle more orders as the business grew.
Healthcare Example
Healthcare teams use process mapping to improve patient care and clinical operations. Hospitals have mapped patient admission and discharge processes to find delays and errors. After making changes, they saw shorter wait times and higher patient satisfaction. Some common results include:
Improved patient care and safety
More efficient clinical operations
Better supply chain management
Enhanced revenue cycle management
For instance, a hospital mapped its patient intake process and found that paperwork caused long delays. By simplifying forms and using digital tools, the team reduced average wait times and increased daily patient throughput. Staff also reported higher job satisfaction because their work became more organized.
Process mapping gives teams in every industry a clear path to efficiency. By making each step visible, organizations can target improvements that deliver lasting results.
Benefits And Best Practices
Reduced Cycle Time
Teams that use Lean Six Sigma Process Mapping often see faster results. They work together to spot delays and remove unnecessary steps. This teamwork helps everyone understand where the process slows down. When teams map out each step, they can quickly find and fix problems.
Many organizations have seen big improvements in cycle time. The table below shows how different companies reduced waste and improved speed:
Organization | Metric | Improvement |
|---|---|---|
General Electric (GE) | Scrap rates | Reduced by 62% |
General Electric (GE) | First-pass yield | Improved by 34% |
Honeywell | Invoice processing time | Reduced by 50% |
Virginia Mason Medical Center | Medication errors | Reduced by 75% |
Manufacturing Firm | Defects (DPMO) | Reduced from 4,500 to 500 |
Call Center | Average handling time (AHT) | Reduced from 8 to 5 minutes |
Teams play a key role in these results. They share ideas, review each step, and make changes together. This system helps everyone move toward the same goal—faster and better processes.
Lower Costs
Lowering costs is a main goal for many organizations. Lean Six Sigma Process Mapping helps teams find waste and cut out steps that do not add value. When teams work together, they can spot problems that one person might miss. This group effort leads to smarter use of resources and less spending.
Lean Six Sigma enhances process efficiency.
It identifies and eliminates waste.
Case studies show significant improvements in operational costs.
Many case studies show that teams using this method save money. They reduce waste, improve cycle times, and boost productivity. The combination of Lean and Six Sigma gives teams a strong way to lower costs. Lean speeds up work, while Six Sigma reduces errors. Together, these systems help organizations improve their financial results.
Teams that use process mapping often find hidden costs. By working together, they can remove these costs and make the process more efficient.
Improved Quality
Quality improves when teams use Lean Six Sigma Process Mapping. They can see where errors or defects happen and fix them before they grow. Process maps give a clear view of each step, so teams can find bottlenecks and make changes that raise quality.
Teams identify areas where errors or defects are likely to occur, leading to better output.
Process mapping provides a visual guide, helping teams spot and fix problems.
Targeted improvements based on maps result in fewer defects and higher standards.
When teams focus on quality, customers notice the difference. Fewer mistakes mean better products and services. Teams that use process mapping set higher standards and keep improving over time.
A clear process map helps teams work together to deliver the best results.
Team Collaboration
Lean Six Sigma process mapping encourages strong team collaboration. Teams work together to create accurate maps of business processes. Each member brings unique knowledge and skills. This shared effort helps teams see the full picture and avoid missing important steps.
Collaboration improves communication. Team members discuss each step and share their experiences. They ask questions and clarify details. This process builds trust and respect among team members. When teams work together, they solve problems faster and make better decisions.
A collaborative approach also helps teams spot errors or gaps. Different perspectives reveal issues that one person might overlook. Teams can use brainstorming sessions to generate ideas for improvement. They can also use visual tools, such as sticky notes or digital mapping software, to organize their thoughts.
Teams that collaborate well often achieve better results. They create process maps that reflect real workflows and support lasting improvements.
Benefits of Team Collaboration in Process Mapping:
Increases accuracy of process maps
Builds a sense of ownership among team members
Encourages open communication and feedback
Helps identify hidden problems and solutions
Stakeholder Involvement
Stakeholder involvement plays a key role in successful process mapping. Stakeholders include anyone affected by the process, such as managers, employees, or customers. Their input ensures that the process map covers all important steps and meets business needs.
Teams invite stakeholders to mapping sessions. Stakeholders share their expectations and concerns. They help define the goals of the project. Their feedback guides the team in making practical changes.
A table below shows common stakeholder roles and their contributions:
Stakeholder Role | Contribution to Process Mapping |
|---|---|
Managers | Set goals and provide resources |
Employees | Share firsthand process knowledge |
Customers | Offer feedback on outcomes |
IT Specialists | Advise on digital tools and automation |
Involving stakeholders early leads to smoother implementation and greater support for changes.
Map Review And Updates
Process maps need regular review and updates. Business processes change over time. Teams must keep maps current to ensure they remain useful.
Teams schedule periodic reviews of process maps. They check for changes in steps, roles, or technology. They update maps to reflect new practices or improvements. This habit helps teams avoid outdated information and keeps everyone aligned.
Best practices for reviewing and updating process maps include:
Set a regular review schedule (e.g., every six months).
Involve team members and stakeholders in the review.
Compare the map to actual workflows.
Document any changes and communicate updates.
Regular updates keep process maps accurate and effective. Teams that review their maps often can respond quickly to new challenges and opportunities.
Lean Six Sigma Process Mapping gives teams a clear view of their workflows, making hidden problems easy to spot. Teams use visual tools, engage stakeholders, and update maps regularly to drive ongoing improvement. The table below highlights key takeaways for organizations:
Description | |
|---|---|
Visual Tools | Flowcharts reveal inefficiencies in workflows. |
Stakeholder Engagement | Early involvement ensures accurate, real-world process maps. |
Keeps maps relevant for continuous improvement. |
Teams can start by observing workflows, breaking down steps, and using SIPOC diagrams. For more guidance or support, readers can contact our organization to learn how process mapping can boost productivity and quality.
FAQ
What is the main purpose of process mapping in Lean Six Sigma?
Process mapping helps teams see every step in a workflow. They use it to find waste, errors, and delays. This tool gives a clear picture of how work happens and where improvements can start.
How does process mapping reduce waste?
Teams use process maps to spot extra steps, repeated tasks, and slowdowns. They remove these problems to make work faster and more efficient. This leads to less wasted time and resources.
Which process map should a team choose first?
Teams often start with a SIPOC diagram. This map gives a high-level view of the process. It helps teams set clear boundaries and understand the main steps before adding more detail.
Can process mapping help in non-manufacturing industries?
Yes. Service, healthcare, and education teams use process mapping to improve workflows. They find delays, errors, and confusion in many types of organizations, not just factories.
How often should teams update their process maps?
Teams should review process maps at least every six months. They update maps when steps, roles, or tools change. Regular updates keep maps useful and accurate.
Who should join a process mapping team?
A strong team includes people who know the process well, subject matter experts, and key stakeholders. Each member brings a different view and helps create a complete map.
What tools can teams use for process mapping?
Teams use paper, whiteboards, or digital tools like Microsoft Visio, Lucidchart, and Miro. Digital tools make it easy to share, edit, and store process maps.
Does process mapping require special training?
Basic process mapping does not need advanced training. Teams can learn simple methods quickly. For complex maps or Lean Six Sigma projects, some training helps teams get better results.


