How Lean Six Sigma Process Mapping Drives Continuous Improvement
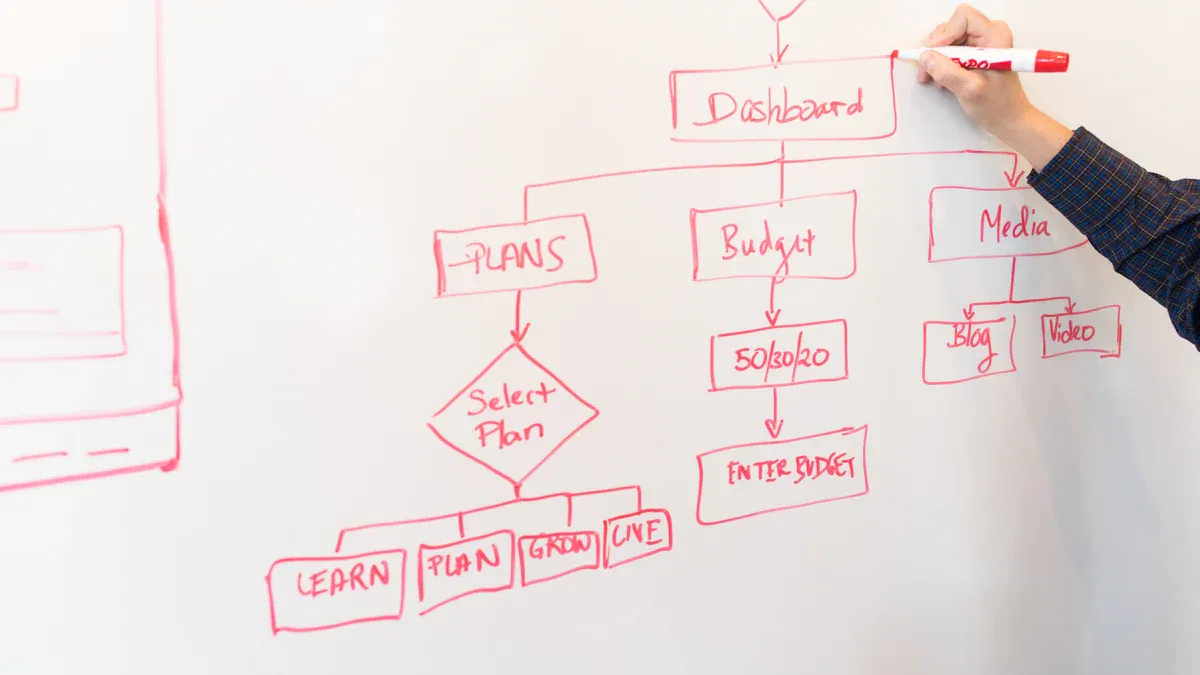
Lean Six Sigma Process Mapping gives organizations a clear path to continuous improvement. By turning process steps into visual diagrams, teams can quickly spot unnecessary actions or errors that affect both clients and customers. Flowcharts and value stream maps break down complex workflows, making it easier to identify bottlenecks and highlight where optimization steps are needed. With these tools, teams see the full picture and gain insights that drive smarter decisions.
Process mapping uses visuals like flowcharts to reveal inefficiencies.
Comparing actual and ideal processes uncovers gaps and improvement opportunities.
Key Takeaways
Process mapping uses visual tools like flowcharts to identify inefficiencies in workflows.
Engaging stakeholders early ensures accurate process maps that reflect real workflows.
Regularly updating process maps keeps them relevant and supports continuous improvement.
Visualizing processes helps teams communicate better and clarify roles and responsibilities.
Using SIPOC diagrams provides a high-level overview, helping teams define project boundaries.
Value Stream Maps highlight both value-added and non-value-added activities for better efficiency.
Standardizing processes through mapping reduces errors and improves overall quality.
Continuous improvement is achieved by regularly reviewing and refining process maps.
Lean Six Sigma Process Mapping Overview
What Is Process Mapping?
Process mapping creates a visual representation of how work moves through an organization. Teams use diagrams to show each step, decision point, and outcome. This approach clarifies business processes and helps teams spot problems and improve quality. In Lean Six Sigma Process Mapping, teams often start with a high-level map, such as a SIPOC diagram, to visualize the process from start to finish. The SIPOC diagram outlines Suppliers, Inputs, Process steps, Outputs, and Customers. Teams build the project charter, write problem and goal statements, set project boundaries, and gather Voice of the Customer insights before mapping begins.
Key Points | Description |
|---|---|
Purpose of Process Mapping | Clarifies business processes, helping teams spot problems and improve quality |
Role in DMAIC | Provides visual tools at each stage, essential for structured improvement |
Benefits | Helps visualize each step, making it easier to identify waste and inefficiencies |
Why Visualize Processes?
Visualizing processes transforms complex information into intuitive formats. Teams see patterns and relationships that raw data cannot reveal. Visual maps facilitate conversations among team members and bridge the gap between data scientists and business decision-makers. Teams identify bottlenecks and inefficiencies by examining the flow of work. Visual tools promote a culture of continuous improvement by tracking the impact of changes. Documentation of the development process over time supports data-driven decision making with quantitative metrics.
Facilitates conversations among team members through visual representations
Identifies bottlenecks and inefficiencies in processes
Promotes a culture of continuous improvement by tracking impacts of changes
Supports data-driven decision making with quantitative metrics
Provides documentation of the development process over time
Teams in manufacturing have reduced cycle times by 25% using process maps. Healthcare systems have decreased patient wait times from over two hours to just 45 minutes. These improvements show the power of visualizing processes.
Key Principles in Lean Six Sigma
Lean Six Sigma relies on several key principles that guide process mapping:
Identifying Value: Teams define what the customer values.
Mapping the Value Stream: Teams visualize the entire process flow required to deliver value and identify waste.
Creating Flow: Work moves smoothly through the process without interruptions or delays.
Establishing Pull: Customer demand pulls work through the process, rather than pushing inventory or tasks forward.
Seeking Perfection: Teams continuously strive to improve the process by eliminating waste and refining flow.
Lean Six Sigma Process Mapping supports the DMAIC cycle:
Define: Teams understand the current state of processes.
Measure: Teams establish baselines for performance.
Analyze: Teams identify inefficiencies and areas for improvement.
Improve: Teams visualize changes and improvements in the process.
Control: Teams monitor process performance over time.
These principles and steps ensure that process mapping drives continuous improvement and helps organizations achieve lasting results.
Process Mapping in the DMAIC Cycle
Define Phase Maps
Process mapping begins in the Define phase. Teams use visual tools to understand the current state of workflows. These maps help set the boundaries of a project and clarify what needs improvement.
Setting Scope
Teams select the right process map to outline the scope. The SIPOC diagram provides a high-level overview by breaking the process into Suppliers, Inputs, Process steps, Outputs, and Customers. High-level process maps focus on major steps, making it easier to spot bottlenecks and redundancies. Swimlane diagrams organize tasks by roles or departments, clarifying responsibilities and handoffs.
Process Map Type | Purpose |
|---|---|
SIPOC Diagram | Offers a broad overview, showing Suppliers, Inputs, Process, Outputs, and Customers. Helps define scope and critical elements. |
High-Level Process Map | Simplifies workflow, highlights major steps, and identifies bottlenecks. Useful for visualizing the entire process. |
Swimlane Diagram | Organizes tasks by roles or departments, clarifies handoffs and responsibilities in cross-functional processes. |
Teams use these maps to set clear project boundaries and focus on areas that matter most.
Stakeholder Input
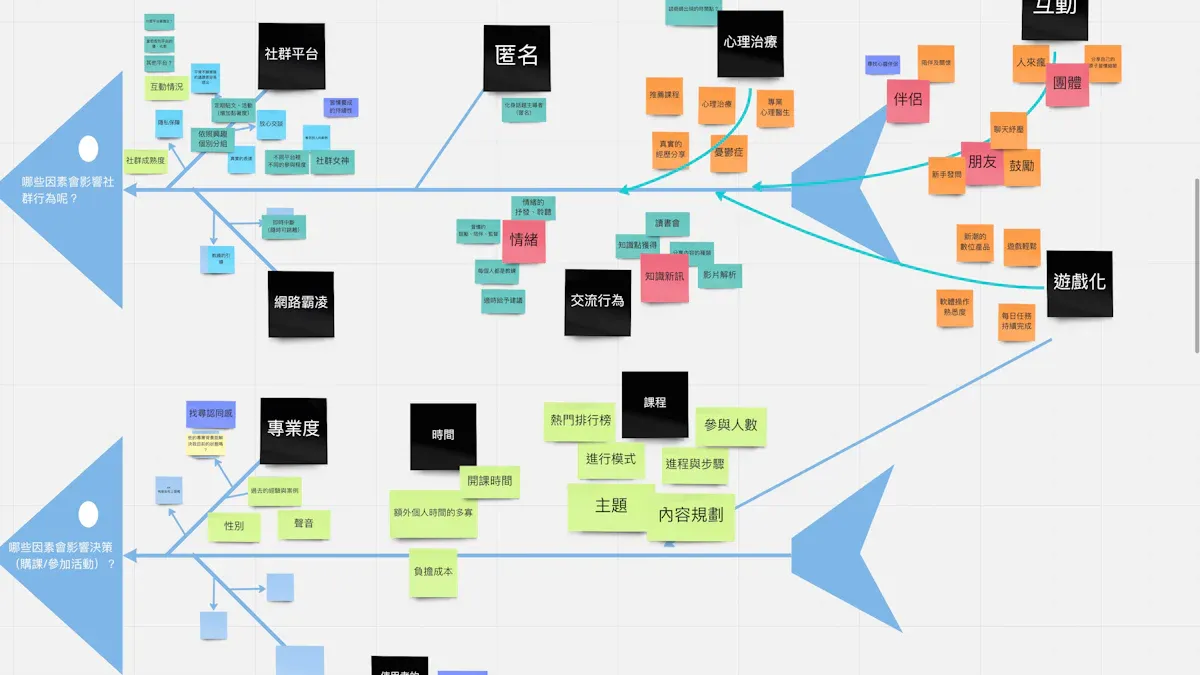
Stakeholder input shapes the process map. Teams gather insights from those involved in the process, including managers, operators, and customers. This input ensures the map reflects real workflows and not just assumptions. Stakeholders help identify pain points and areas for improvement. Their feedback guides the team in setting priorities and aligning goals.
Tip: Involve stakeholders early to build accurate maps and gain support for improvement efforts.
Measure Phase Maps
The Measure phase uses process maps to collect data and establish baselines. Teams identify inputs and outputs, then track performance to understand how the process works.
Inputs and Outputs
Teams map out the factors that influence the process (inputs) and the results produced (outputs). Critical to Quality (CTQ) factors are highlighted, showing what must be monitored to ensure high standards.
Aspect | Description |
|---|---|
Inputs (X) | Factors that influence the process and require measurement. |
Outputs (Y) | Results of the process, evaluated against the inputs. |
Critical to Quality (CTQ) | Key factors that determine output quality and must be tracked. |
Process Inefficiencies | Areas identified through mapping that need improvement. |
Data Collection Steps | Steps for gathering accurate data for analysis. |
Teams use these maps to validate measurement systems and ensure data accuracy. They determine process capability and set performance baselines.
Baseline Data
Teams collect baseline data to measure current performance. This data helps identify gaps between actual and desired outcomes. Accurate baselines allow teams to track progress and measure the impact of changes. Teams focus on gathering reliable data, using process maps to pinpoint where and how to collect information.
Analyze Phase Maps
The Analyze phase uses process maps to find bottlenecks and root causes of inefficiencies. Teams rely on visual tools to make sense of complex workflows.
Identifying Bottlenecks
Value Stream Mapping (VSM) shows the flow of materials and information across all steps. Teams use VSM to spot bottlenecks, non-value-added activities, and waste. Gemba Walks involve observing the process in action, helping managers see where delays or problems occur. These techniques highlight areas that slow down the process or reduce quality.
Root Cause Focus
Teams collect and analyze data points such as cycle times, defect rates, and downtime records. This analysis reveals patterns and trends that point to the root cause of problems. Teams use qualitative methods like the 5 Whys and Fishbone diagrams to complement their findings. By combining visual maps and data analysis, teams target the source of inefficiencies and plan effective solutions.
Note: Lean Six Sigma Process Mapping supports each DMAIC phase by providing visual clarity, reducing errors, and eliminating waste. Teams use mapping to triage issues and drive continuous improvement.
Phase | Contribution of Process Mapping |
|---|---|
Define | Helps in understanding the current state of processes. |
Measure | Establishes baselines for performance. |
Analyze | Identifies inefficiencies and areas for improvement. |
Improve Phase Maps
Process mapping plays a key role in the Improve phase of DMAIC. Teams use these maps to design and test new solutions that address the root causes found earlier. A clear process map shows the ideal workflow, which helps teams set expectations and reduce confusion.
Designing Solutions
Teams create a visual map of the improved process. This map highlights the changes needed to remove waste and errors. By comparing the current and future state maps, teams can see exactly where improvements will occur.
Process maps give a clear picture of the ideal process. This helps everyone understand what should happen at each step.
The maps set default actions for team members. This reduces the mental effort needed to make decisions.
Teams use the improved map as a baseline. They can measure how well the new process matches the ideal and spot any gaps.
Visual maps encourage better teamwork. Everyone can see the plan and work together to reach the goal.
A well-designed process map makes it easier for teams to move from ideas to action. It also helps them explain changes to others in the organization.
Testing Changes
After designing the improved process, teams use the map to guide small-scale tests. These tests help confirm that the changes work as planned. Teams track results and update the map if they find new issues.
Tip: Start with pilot tests in a controlled setting. Use the process map to document what works and what needs adjustment.
Teams repeat this cycle until the new process meets performance goals. The process map becomes a living document that guides further improvements.
Control Phase Maps
The Control phase ensures that improvements last over time. Process maps help teams standardize the new way of working and monitor results.
Standardization
Teams use process maps to document the final, improved workflow. This visual guide helps everyone follow the same steps, which reduces mistakes and confusion.
Control phase maps show the standard way to complete tasks. This keeps processes consistent across teams.
Teams use these maps to train employees on new procedures. Clear visuals make learning easier and faster.
Documenting the workflow lowers the risk of errors. Everyone knows what to do and when to do it.
Standardized process maps become the reference point for daily operations. They help teams maintain high quality and efficiency.
Ongoing Monitoring
Teams use process maps to track performance and spot problems early. Regular reviews of the map help teams see if the process drifts from the standard.
Process maps support ongoing monitoring and quick adjustments. Teams can update the map when they find better ways to work.
Visual workflows make it easier to see trends and catch issues before they grow.
Teams use the maps to guide audits and continuous improvement efforts.
Note: Process mapping in the Control phase helps organizations sustain gains and build a culture of continuous improvement.
Types of Lean Six Sigma Process Maps
SIPOC Diagram
A SIPOC diagram gives teams a high-level view of a process before they dive into details. SIPOC stands for Suppliers, Inputs, Process, Outputs, and Customers. This tool helps teams define the boundaries of a project and align everyone on what the process includes.
Aspect | SIPOC Diagram | Detailed Process Map |
|---|---|---|
Primary purpose | Strategic alignment and project scoping | Operational execution and troubleshooting |
Granularity | Granular (20+ steps, decisions, loops) | |
Time to create | One to two hours (collaborative session) | Days to weeks (observation and documentation) |
Teams start by listing the suppliers who provide the necessary inputs. They then identify the materials, resources, or information required. The process section outlines the main steps that transform inputs into outputs. Outputs show the end products or services, while customers are those who benefit from the results. This structure ensures that teams focus on what matters most for quality and customer satisfaction.
Research shows that using structured, high-level process alignment like SIPOC can lead to a 95% success rate in organizational redesign projects when teams use proper frameworks. SIPOC diagrams work best at the start of Lean Six Sigma Process Mapping projects, helping teams set clear goals and avoid confusion.
Value Stream Map
A Value Stream Map (VSM) shows every step in delivering a product or service. This map highlights both value-added and non-value-added activities. Teams use VSM to find waste and improve efficiency.
Value Stream Mapping displays the flow of materials and information. It also shows cycle times for each step. By looking at the entire process, teams can see where delays or unnecessary steps occur. This makes it easier to spot areas that do not add value.
VSM helps organizations make better decisions. They can remove waste and focus on activities that improve quality and speed. Many teams use Value Stream Maps to guide improvement projects and track progress over time.
Swimlane Map
A Swimlane Map, also called a deployment flowchart, divides a process by roles or departments. Each "lane" represents a person or team responsible for certain steps. This format makes it easy to see who does what and when.
Swimlane diagrams work well for processes with many handoffs or shared responsibilities.
They clarify ownership of tasks and reduce confusion about who should act at each stage.
These maps help teams find inefficiencies, especially when several departments or roles interact.
For example, a toy business used a swimlane diagram to manage customer service requests. The map showed the roles of the customer, clerk, and service department. This helped standardize the process and improve response times.
Swimlane Maps support collaboration and communication. They make complex processes easier to understand and improve.
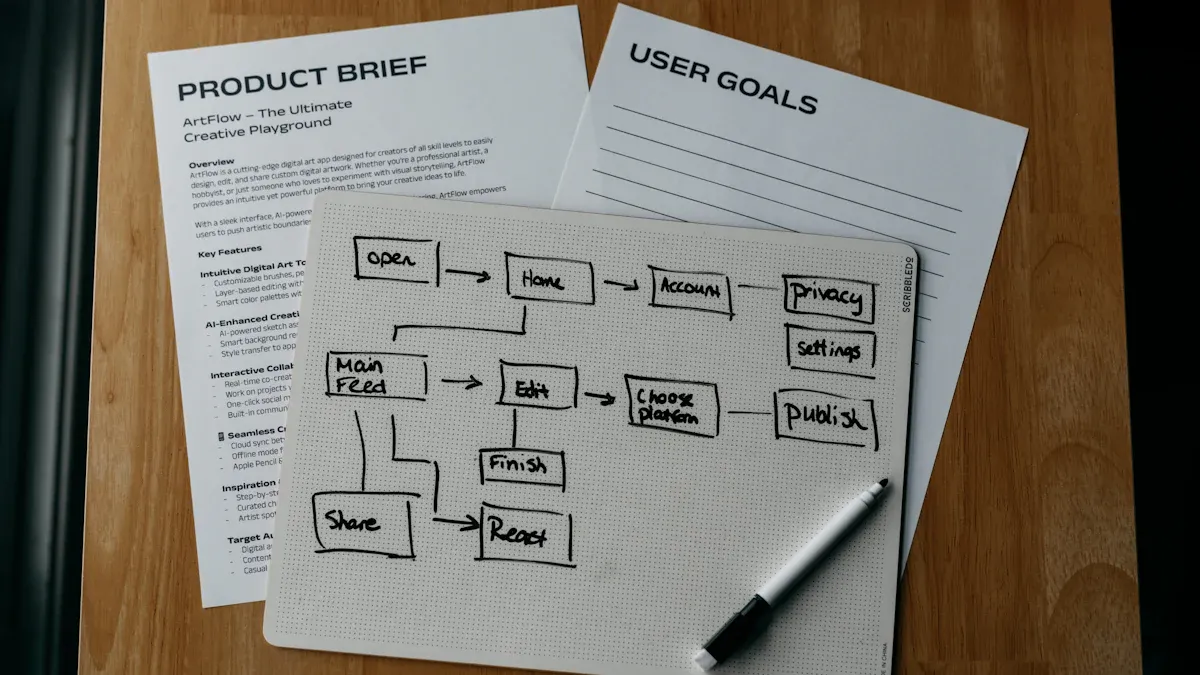
Detailed Flowchart
A Detailed Flowchart gives teams a close look at every step in a process. This tool helps people see how work moves from start to finish. Teams use flowcharts to break down tasks, decisions, and actions into simple shapes and lines. Each shape stands for a different part of the process. Ovals show where the process begins or ends. Rectangles mark tasks or actions. Diamonds represent decision points where choices must be made.
The Process Flowchart forms a key part of the DMAIC framework in Lean Six Sigma. It shows the order of steps and helps teams find places where work slows down or mistakes happen. By mapping each step, teams can spot problems that might not be obvious. They can see where tasks repeat, where delays occur, or where errors slip through.
A Detailed Flowchart focuses on granular details. Teams use it to look for root causes of inefficiencies. They can see every action and decision, making it easier to find what needs fixing. This level of detail helps teams plan improvements that target the real issues.
A Detailed Process Flowchart breaks a process into individual steps.
It uses symbols like ovals, rectangles, and diamonds to show start points, tasks, and decisions.
Teams use flowcharts to find root causes of problems and plan better ways to work.
Tip: Teams should use standardized symbols and clear labels. This makes the flowchart easy to read and understand for everyone involved.
Choosing the Right Map
Selecting the best process map depends on several factors. Teams must think about how much detail they need, how many people will take part, and what problems they want to solve. The right map helps teams focus on the most important issues and makes improvement easier.
Criteria | Description |
|---|---|
Determines how much information is needed in the process map. | |
Number of Stakeholders Involved | Assesses how many people need to be engaged in the mapping process. |
Type of Inefficiencies Addressed | Identifies specific problems that the process map aims to resolve. |
Teams choose a SIPOC diagram when they need a high-level overview. They use a Value Stream Map to see how materials and information flow. Swimlane Maps work best for processes with many handoffs between departments. Detailed Flowcharts help when teams need to look closely at every step.
Note: Teams should match the map to their goals. The right map makes it easier to find waste, errors, and areas for improvement.
A careful choice leads to better results. Teams can solve problems faster and make lasting changes. The process map becomes a guide for continuous improvement.
Benefits of Process Mapping
Waste Reduction
Process mapping helps organizations see where waste occurs in their workflows. Teams use visual tools to spot unnecessary steps, delays, and extra movement. By making each part of the process visible, they can remove actions that do not add value. This leads to better use of time, materials, and resources.
Many types of waste can slow down a process. The table below shows common types of waste that process mapping helps identify:
Type of Waste | Description |
|---|---|
Motion | Unnecessary movement of people due to poor workstation layout, leading to productivity loss. |
Waiting | Wasted time when employees or machines are idle, often due to bottlenecks or upstream issues. |
Overproduction | Producing more than needed, leading to excess inventory and resource waste. |
Teams often find these problems when they compare their current process to an ideal one. They may see excess inventory, idle time, or underused equipment. By removing these wastes, organizations can save money and improve efficiency.
Common wastes found through process mapping:
Excess inventory and overproduction
Idle time due to unsynchronized operations
Quality defects leading to rework
Underutilized equipment and human resources
Lean Six Sigma Process Mapping gives teams a clear way to reduce waste and focus on what matters most.
Error Prevention
Process mapping also helps prevent errors. When teams create a visual map, they can see where mistakes might happen. They use this information to make changes that improve accuracy and quality.
The table below explains how process mapping supports error prevention:
Evidence Description | Contribution to Error Prevention |
|---|---|
Value stream mapping identifies wasteful steps | Eliminates unnecessary tasks that do not add value, reducing potential errors in processes. |
RPA automates repetitive tasks | Reduces human error by minimizing manual intervention in data handling. |
Standardization of processes | Ensures consistency in operations, leading to improved accuracy and reduced errors. |
Teams use value stream mapping to remove steps that cause confusion or mistakes. Automation of repetitive tasks, such as data entry, lowers the risk of human error. Standardizing processes means everyone follows the same steps, which leads to fewer errors and better results.
Better Communication
Clear communication is another benefit of process mapping. Visual tools help teams understand each step and see who is responsible for what. This reduces confusion and makes it easier to solve problems together.
Teams use SIPOC diagrams to show process boundaries and identify key contributors. This helps everyone know their role and speeds up problem-solving. Swimlane diagrams assign clear ownership of tasks and make handoffs between departments visible. This reduces confusion and improves teamwork.
Process mapping improves communication by:
Clarifying process boundaries and roles
Making handoffs between departments visible
Encouraging regular reviews and feedback sessions
Building trust and openness among team members
Regular reviews of process maps help teams keep their information up to date. Open communication builds trust and encourages people to share their ideas. Lean Six Sigma Process Mapping supports better communication and collaboration across the organization.
Sustained Improvement
Sustained improvement stands as a core goal in Lean Six Sigma initiatives. Process mapping plays a vital role in helping organizations achieve long-lasting results. Teams use process maps to create a clear visual of how work flows from start to finish. This visual approach makes it easier to spot inefficiencies and areas that need change. When teams see each step, they can focus on what adds value for customers and remove what does not.
Process maps do more than just show the current state. They act as a shared language for everyone involved. People from different departments can look at the same map and understand the process in the same way. This shared understanding helps teams work together and avoid confusion. When everyone uses the same visual guide, communication improves and mistakes decrease.
Teams often update process maps as they make changes. These updates keep the maps aligned with business goals. When a company changes its strategy or adds new technology, teams can adjust the process map to match. This habit of updating maps supports continuous improvement. It ensures that the process always reflects the best way to work.
Regular reviews of process maps help teams catch problems early. They can see if the process drifts from the standard and take action before issues grow.
Process mapping also supports data-driven decisions. By making hidden problems visible, teams can use real data to decide where to focus their efforts. They can measure how changes affect the process and track progress over time. This focus on facts leads to better results and helps teams avoid guessing.
Some key ways process mapping supports sustained improvement include:
Providing a visual representation of workflows, which helps teams identify inefficiencies and areas for improvement.
Acting as a shared language for teams, which enhances understanding across departments.
Making hidden problems visible, which supports data-driven decisions and focuses on value addition for customers.
Allowing continuous updates to process maps, which ensures alignment with business goals and leads to sustained improvements.
Teams that use process mapping as an ongoing practice build a culture of improvement. They do not settle for one-time fixes. Instead, they look for ways to keep getting better. This mindset helps organizations stay competitive and deliver high-quality results year after year.
Applying Process Mapping in Your Organization
Building a Mapping Team
A strong mapping team forms the foundation for successful process improvement. Teams in Lean Six Sigma projects often include members from different departments. Each person brings unique knowledge about the process. Leaders select individuals who work directly with the process, as well as those who oversee its outcomes. This approach ensures the map reflects real workflows.
Teams follow best practices to build effective mapping groups:
Best Practice | Description |
|---|---|
Clear Scope | Define what the process map covers to align with business goals. |
Balanced Detail | Include enough detail to guide users but avoid overwhelming them. |
Consistent Symbols and Notation | Use the same symbols and notation throughout the map to prevent confusion. |
Stakeholder Engagement | Involve people who work with the process for accurate mapping. |
Divide Complex Processes | Break large workflows into smaller maps for clarity. |
Regular Reviews and Updates | Review and update process maps often to keep them current. |
Testing and Validation | Test the process map with real scenarios to find gaps or errors. |
Continuous Feedback | Gather feedback to make sure the map stays useful and effective. |
Teams define clear goals for the mapping process. They select the right type of process map and document workflows accurately. Stakeholder engagement remains essential throughout the mapping process. Regular reviews and feedback help keep maps relevant and effective.
Selecting a Process
Choosing the right process to map is a critical step. Teams look for workflows that impact business goals or customer satisfaction. They focus on processes with clear boundaries and measurable outcomes.
A simple approach guides process selection:
Define goals. Teams set objectives such as reducing delays or improving quality.
Determine scope. They identify where the process starts and ends.
Identify steps. Teams list all actions and decision points in the process.
Teams often select processes that show signs of waste or errors. For example, a manufacturing team may map the order fulfillment process to reduce cycle times. In healthcare, teams might choose patient intake to improve service speed. By targeting high-impact areas, organizations achieve visible results and drive continuous improvement.
Tip: Teams should start with processes that have clear problems or opportunities. This makes it easier to measure improvement and gain support.
Facilitating Mapping Sessions
Successful mapping sessions require careful planning and active participation. Teams gather stakeholders who know the process best. Facilitators encourage everyone to share insights and document each step clearly.
Best practices for mapping sessions include:
Engage the right stakeholders to gain valuable insights.
Document process steps clearly to avoid confusion.
Use standardized symbols for consistency.
Gather team feedback to ensure relevance and usability.
Review and update process maps regularly.
Facilitators set a specific scope to keep sessions focused. They list every step in the process and use brainstorming to collect information. Teams use simple language so everyone understands the workflow. Regular reviews help maintain the effectiveness of process maps.
Organizations that follow these steps see improvements in efficiency and quality. Teams use process maps to guide changes, monitor progress, and sustain results. Practical application of mapping leads to better communication, reduced waste, and ongoing success.
Turning Maps into Action
Teams move from mapping to improvement by turning process maps into actionable plans. They use data to enhance process maps and transform them into intelligence systems that guide decisions. Clear objectives help teams select the right data and measure success. Teams gather both numbers and stories to find inefficiencies. They analyze this information to uncover bottlenecks and redundancies.
Teams refine workflows by translating insights from data into process map improvements.
Performance indicators are added to maps to track progress and measure results.
Technology supports real-time data integration, making continuous improvement possible.
Teams monitor updated process maps regularly and refine them to ensure effectiveness.
Teams set goals for each improvement project. They use process maps to identify where changes will have the most impact. By focusing on areas with clear data, teams make improvements that last. Teams also communicate changes to everyone involved, using visual maps to explain new workflows. This approach helps teams stay aligned and work together toward better results.
Tip: Teams should review process maps often and update them as processes evolve. This habit keeps maps relevant and supports ongoing improvement.
Avoiding Common Pitfalls
Organizations face several challenges when applying process mapping. Inconsistency in using standardized notations increases confusion among stakeholders. Failing to maintain process maps over time leads to outdated documentation. Teams sometimes depend on people who do not work directly with the process, which undermines accuracy. Using ineffective tools, such as low-quality software, can compromise the mapping effort.
Teams should avoid mapping the ideal process instead of the real one. Unrealistic maps do not help solve actual problems. Excluding frontline employees misses critical friction points. Overcomplicating visuals reduces clarity and makes it hard for stakeholders to engage. Skipping validation with stakeholders risks missing key steps or exceptions. Treating process mapping as a one-time event results in maps that fail to reflect evolving processes.
Map the real process, not just the ideal version.
Include frontline employees to capture important insights.
Keep visuals simple and clear for easy understanding.
Validate maps with stakeholders to ensure accuracy.
Update process maps regularly to reflect changes.
Teams should also avoid ignoring exceptions in processes. Missing these details leads to incomplete maps. Excluding the right people from mapping efforts results in missing critical insights. Failing to update maps over time makes them obsolete and ineffective.
Note: Teams that follow best practices and avoid common pitfalls create process maps that drive real improvement and support continuous success.
Real-World Success Stories
Manufacturing Example
Many manufacturing organizations have used Lean Six Sigma process mapping to transform their operations. Teams in these companies mapped their workflows, found waste, and made changes that improved results. The table below shows how different manufacturers achieved success:
Organization | Application Area | Measurable Results and Improvements |
|---|---|---|
Aerospace Parts Manufacturer | Machining cycle time | 46% reduction in cycle time; 80% decrease in process variation; increased productivity and profitability. |
Catalent Pharma Solutions | Pharmaceutical production | Reduced defect rates; improved batch maintenance; cost reduction. |
Baxter Manufacturing | Environmental performance | Reduced waste; doubled revenue; significant water and cost savings. |
Texas Department of Licensing and Regulation (TDLR) | Records management | Reduced storage costs; streamlined processes; robust records management. |
Ford Motors | Automotive manufacturing | $2.19 billion waste reduction; $1 billion cost savings; 5-point increase in customer satisfaction. |
These examples show that process mapping helps teams see where problems exist. They can then focus on removing waste and improving quality. Ford Motors, for example, used process mapping to save billions of dollars and raise customer satisfaction. Baxter Manufacturing doubled its revenue by reducing waste and saving resources.
Service Industry Example
Service organizations also benefit from Lean Six Sigma process mapping. Teams in these settings use maps to understand their workflows and improve service delivery. The table below highlights some areas where service teams have seen positive outcomes:
Application Area | Documented Outcomes |
|---|---|
Service Organizations | Improved customer satisfaction, increased profit margins |
Call Centers | Reduced costs and lower turnover |
Surgical Suites | Enhanced process efficiency and quality |
Government Offices | Streamlined operations and reduced waste |
Procurement | Cost savings and improved service delivery |
R&D | Faster project completion and better resource allocation |
For example, call centers mapped their processes to find steps that caused delays. By removing these steps, they lowered costs and kept more employees. Surgical suites used process mapping to improve how they prepared for operations, which led to better patient care.
Lessons Learned
Organizations that use Lean Six Sigma process mapping learn important lessons. The table below lists key principles and their benefits:
Principle | Benefit |
|---|---|
Customer Focus | Improves satisfaction and quality |
Data-Driven Decisions | Ensures accurate problem-solving |
Continuous Improvement | Keeps processes efficient and relevant |
Collaboration | Builds teamwork and shared understanding |
Goal Alignment | Connects daily work to business success |
Teams also find that:
Process visibility enhances understanding of workflows and identifies bottlenecks.
Waste reduction identifies and eliminates non-value-adding activities.
Continuous improvement fosters ongoing enhancements in productivity and quality.
Short-term fixes may solve problems quickly, but they often create new issues later. Teams that focus only on immediate results risk missing deeper problems in their systems.
These lessons show that process mapping works best when teams focus on long-term improvement, use data to guide decisions, and work together toward shared goals.
Lean Six Sigma process mapping gives teams a clear, visual roadmap for ongoing improvement. Teams identify waste, reduce errors, and sustain results by using process maps. Process mapping helps organizations build stronger workflows and achieve lasting success.
Teams can start mapping their processes today.
Process maps support continuous improvement in any industry.
For more information about how systems and teams achieve similar results, readers can reach out to learn more.
FAQ
What is Lean Six Sigma process mapping?
Lean Six Sigma process mapping creates visual diagrams of workflows. Teams use these diagrams to identify waste, errors, and improvement opportunities. The maps help organizations understand how work moves from start to finish.
How does process mapping reduce waste?
Process mapping shows every step in a workflow. Teams spot unnecessary actions, delays, and extra movement. Removing these steps improves efficiency and saves resources.
Which process map should a team use?
Teams select maps based on their goals. SIPOC diagrams provide high-level views. Value Stream Maps show material and information flow. Swimlane diagrams clarify roles. Detailed flowcharts break down each step.
Can process mapping prevent errors?
Yes. Process mapping highlights where mistakes happen. Teams standardize steps and automate repetitive tasks. This reduces confusion and lowers the risk of errors.
Who should join a process mapping team?
A process mapping team includes people who work with the process daily. Managers, operators, and stakeholders bring different perspectives. Their input ensures the map reflects real workflows.
How often should teams update process maps?
Teams review and update process maps regularly. Changes in technology, strategy, or workflow require updates. Keeping maps current supports continuous improvement.
What are common pitfalls in process mapping?
Teams sometimes map ideal processes instead of real ones. Excluding frontline employees misses key insights. Overcomplicated visuals reduce clarity. Regular validation and updates prevent these issues.
Does process mapping work in service industries?
Yes. Service teams use process mapping to improve customer satisfaction, reduce costs, and streamline operations. The maps help identify bottlenecks and enhance service delivery.


