How to Achieve Quality Results through Six Sigma Process Mapping
Six Sigma Process Mapping gives teams a clear visual of how activities move through workflows. They see each step, spot bottlenecks, and address inefficiencies. Teams in Hiring Systems and Business Management apply these tools to reduce waste and boost consistency. The table below shows how mapping, value stream maps, and control charts help teams optimize and monitor processes:
Tool | Description |
|---|---|
Process Maps | Visual representation to understand activity flow, identify bottlenecks, and optimize tasks. |
Value Stream Map | Analyzes and visualizes the flow of materials and information to optimize processes. |
Control Charts | Monitors process stability over time, identifying variations and deviations from the norm. |
Lean methods eliminate unnecessary steps. Six Sigma reduces variations in remaining steps, improving quality. This approach gives teams the knowledge to drive measurable improvements.
Key Takeaways
Six Sigma Process Mapping provides a clear visual of workflows, helping teams identify bottlenecks and inefficiencies.
Using process maps allows teams to visualize changes before implementing them, ensuring better planning and assessment.
Identifying inefficiencies through data analysis leads to targeted improvements that significantly enhance quality.
Regular audits and employee feedback help maintain alignment between documented workflows and actual practices.
Implementing Lean Six Sigma methods reduces waste by eliminating unnecessary steps, boosting overall efficiency.
Continuous monitoring of process performance ensures that improvements are sustained over time.
Training teams on process mapping techniques fosters a culture of continuous improvement and adaptability.
Data-driven decision-making from process mapping supports ongoing optimization and enhances customer satisfaction.
Six Sigma Process Mapping for Quality
Visualizing Workflows
Six Sigma Process Mapping gives teams a clear picture of each step in a workflow. They see how tasks connect and where activities overlap. This visual approach helps teams understand the entire process, making it easier to spot areas for improvement. Research shows that process mapping provides a baseline for planning changes and assessing their impact. Teams use these maps to visualize changes before making adjustments.
Process mapping helps visualize and understand processes, providing a clear view of steps and their interconnections.
It aids in identifying waste and inefficiencies, making it easier to spot redundancies and bottlenecks.
Process maps serve as a baseline for planning and implementing improvements, allowing teams to visualize changes and assess their impact.
Teams in manufacturing, healthcare, and service industries use Six Sigma Process Mapping to clarify complex workflows. They rely on these maps to guide improvement projects and ensure every step adds value.
Identifying Inefficiencies
Teams use Six Sigma Process Mapping to find steps that do not add value. They analyze each part of the workflow to locate bottlenecks and redundancies. This method allows teams to focus on areas where improvements will have the greatest impact. The table below highlights how identifying inefficiencies leads to measurable improvements:
Evidence Type | Description |
|---|---|
Data Analysis | Identifying steps that fail to add value and where improvements will have the greatest impact. |
Workflow Adjustments | Revised process maps should include performance indicators to define success and streamline workflows. |
Employee Feedback | Validating updated maps with employees ensures practical changes and identifies potential obstacles. |
Continuous Improvement | Establishing performance indicators aligned with strategic objectives for ongoing effectiveness. |
Regular Audits | Scheduled audits help maintain alignment between documented workflows and actual practices. |
Teams often update process maps after collecting feedback from employees. They use audits to check if the documented workflow matches real-world practices. These steps help teams maintain quality and consistency over time.
Reducing Waste
Six Sigma Process Mapping plays a key role in reducing waste. Teams use these maps to eliminate unnecessary steps and streamline operations. Lean Six Sigma methods focus on removing activities that do not add value. The table below presents case studies that show how organizations achieved significant waste reduction:
Case Study | Description | Results |
|---|---|---|
Catalent Pharma Solutions | Addressed high mistake rates in Zydis product line using Six Sigma methodologies. | Improved production and reduced losses. |
TDLR's Record Management | Reduced storage costs and streamlined processes through Six Sigma. | Significant cost savings and improved efficiency. |
Baxter Manufacturing | Enhanced environmental performance and reduced waste generation. | Achieved water and cost savings without major investments. |
Aerospace Manufacturer | Cut machining cycle time and reduced costs using Six Sigma. | 46% reduction in cycle time and 80% decrease in variation. |
Ford Motors | Streamlined processes and reduced waste significantly. | $2.19 billion in waste reduction and $1 billion in savings. |
3M's Pollution Prevention | Pioneered pollution prevention with Six Sigma. | Saved $1 billion and reduced pollutants significantly. |
Organizations in different industries use Six Sigma Process Mapping to achieve measurable results. They report lower costs, improved efficiency, and reduced environmental impact. These successes show the value of process mapping in driving quality and operational excellence.
DMAIC Steps in Six Sigma Process Mapping
Define
Set Process Boundaries
Teams begin the Six Sigma Process Mapping journey by defining the boundaries of the process. They determine where the process starts and ends, which helps prevent scope creep and keeps improvement efforts focused. Clear boundaries ensure that everyone understands what falls inside and outside the project’s scope.
A poorly constructed scope statement leads to scope creep, which Eckes says is the second most common reason projects fail, after poor team dynamics. Use a scope statement template, include the deliverables, and state what is inside and outside the project team’s boundaries.
Defining boundaries also helps teams outline deliverables and clarify responsibilities. This step sets the foundation for accurate mapping and successful project outcomes.
Establish Goals
After setting boundaries, teams establish specific goals for the process. They identify what they want to achieve, such as reducing defects or improving cycle time. Goals provide direction and help measure success. Teams use these goals to guide their mapping efforts and ensure that every step adds value.
The table below shows documented steps that contribute to quality outcomes in Six Sigma projects:
Step Number | Description |
|---|---|
1 | Define the scope of the process, outlining where it starts and ends. |
2 | Identify and sequence the individual steps within the process. |
3 | Review and analyze the process map for accuracy, ensuring all actions are captured correctly. |
Measure
Gather Data
Teams gather data to understand how the process performs. They use different methods to collect accurate information, such as surveys, interviews, and direct observations. Data collection helps teams identify areas for improvement and supports informed decision-making.
Method | Description |
|---|---|
Surveys and Questionnaires | Standardized tools for collecting quantitative and qualitative data from large groups. |
Interviews and Focus Groups | Direct discussions that provide in-depth insights into processes and potential improvements. |
Observations and Direct Measurements | Captures actual performance data and identifies inefficiencies through time studies. |
Historical Data Analysis | Utilizes existing databases to analyze trends and gather valuable process information. |
Map Inputs and Outputs
Teams map the inputs and outputs of each process step. This mapping shows how resources flow through the process and highlights connections between activities. By understanding inputs and outputs, teams can spot inefficiencies and track how changes affect results.
Common metrics used to measure process performance include:
Defects per Unit (DPU)
Defects per Opportunity (DPO)
Yield
Efficiency
Effectiveness
Cycle Time
Process Yield
These metrics help organizations evaluate process performance, identify defects, and measure efficiency.
Analyze
Find Bottlenecks
Teams analyze the process map to find bottlenecks that slow down operations. They use tools like value stream mapping, 5 Whys analysis, Kanban systems, and statistical process control to pinpoint problem areas.
Tool | Description |
|---|---|
Value Stream Mapping | A technique that visually represents the flow of materials and information across all process steps. |
5 Whys Analysis | A method for tracing a problem back to its root cause by repeatedly asking 'why' until the cause is found. |
Kanban Systems | A visual system for managing work as it moves through a process, helping to identify bottlenecks. |
Statistical Process Control | A method that uses statistical techniques to monitor and control a process, identifying variations that may indicate bottlenecks. |
Identify Root Causes
Teams identify root causes of inefficiencies or quality problems. This step uncovers underlying issues and supports continuous improvement. Addressing root causes leads to cost savings, reduces waste, and improves risk management.
Identifies underlying issues causing process inefficiencies or quality problems.
Promotes continuous improvement by addressing root causes.
Leads to significant cost savings by minimizing rework and waste.
Plays a crucial role in risk management by identifying potential problems before they occur.
Teams often use process mapping and value stream mapping to support root cause analysis.
Improve
Implement Solutions
Teams move to the Improve phase after analyzing process maps and identifying root causes. They select solutions that address specific problems and focus on eliminating waste. Process maps give a clear view of each step, helping teams spot errors and defects. This visual approach allows users to track progress and ensure that changes target the right areas.
Process maps show business activities and highlight opportunities for improvement.
Careful tracking of each step helps teams remove unnecessary actions.
Implementing solutions based on process mapping leads to continuous improvement.
Teams often use brainstorming sessions and pilot programs to test new ideas. They document changes and monitor results to confirm that improvements work as intended. This method ensures that solutions align with project goals and deliver measurable benefits.
Test Changes
Testing changes is a critical step in the Improve phase. Teams run small-scale trials to evaluate the effectiveness of new solutions. They collect data and compare results to previous performance. This approach helps teams identify any issues before making changes permanent.
Teams use feedback from employees and stakeholders to refine solutions. They adjust process maps to reflect successful changes and remove steps that do not add value. Testing ensures that improvements are practical and sustainable.
Control
Monitor Results
The Control phase focuses on maintaining improvements over time. Teams establish control systems to track process performance and detect deviations. Regular monitoring helps organizations sustain gains and prevent old problems from returning.
Monitoring Technique | Description |
|---|---|
Control Systems | Establishes systems to ensure long-term effectiveness of changes. |
Key Performance Indicators | Defines metrics to measure success and guide monitoring efforts. |
Monitoring Plan | A structured approach to regularly assess process performance. |
Continuous monitoring is essential for detecting changes in process performance. Teams use control charts and statistical process control techniques to assess results. These tools provide early warnings when processes drift from desired outcomes.
Control charts help teams spot variations quickly.
Statistical process control techniques support ongoing assessment.
Employee engagement plays a key role in sustaining improvements.
Sustain Improvements
Sustaining process stability requires ongoing effort. Teams commit to regular reviews and updates of process maps. They encourage a culture of continuous improvement, where employees stay engaged and alert to changes.
Regular monitoring of process performance ensures that improvements last. Teams use key performance indicators to measure success and guide future actions. This commitment to vigilance helps organizations maintain quality and efficiency over time.
Sustaining improvements is not a one-time effort. Teams must remain vigilant and dedicated to continuous improvement. Regular monitoring and employee involvement are vital for long-term success.
Benefits of Process Mapping
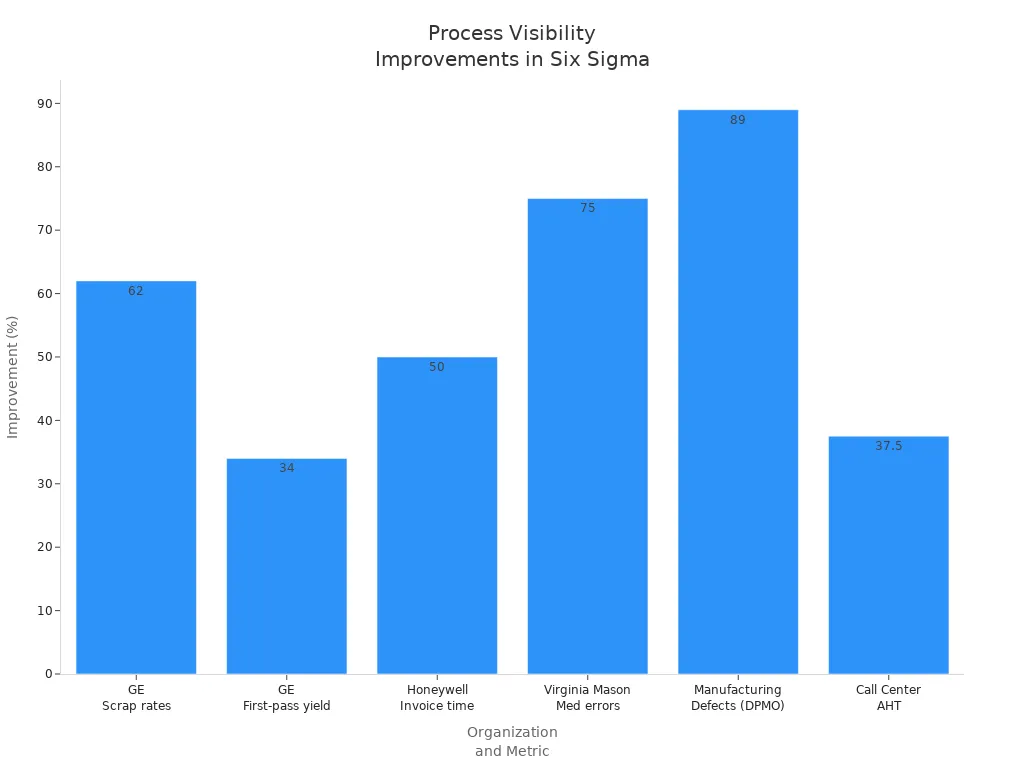
Process Visibility
Systems and teams rely on Six Sigma Process Mapping to gain clear visibility into their workflows. This approach allows them to see each step, identify gaps, and understand how tasks connect. When teams visualize their processes, they can spot bottlenecks and redundancies that slow down progress and waste resources. Process mapping enhances transparency and reveals unnecessary complexities that hinder productivity.
Teams that use process mapping often find it easier to pinpoint areas for improvement and support continuous progress.
Organizations have reported significant improvements after increasing process visibility. The table below highlights real-world results:
Organization | Metric | Improvement |
|---|---|---|
General Electric (GE) | Scrap rates | Reduced by 62% |
General Electric (GE) | First-pass yield | Improved by 34% |
Honeywell | Invoice processing time | Reduced by 50% |
Virginia Mason Medical Center | Medication administration errors | Reduced by 75% |
Manufacturing Firm | Defects (DPMO) | Reduced from 4,500 to 500 DPMO |
Call Center | Average handling time (AHT) | Reduced from 8 minutes to 5 minutes |
Consistency
Process mapping helps systems and teams achieve consistency in their operations. By documenting each step, teams ensure that everyone follows the same procedures. This reduces variation and improves quality. Consistent processes make it easier to train new employees and maintain standards across different departments.
Teams use process maps to standardize workflows.
Consistency leads to fewer errors and higher reliability.
Documented processes support compliance with industry regulations.
When organizations maintain consistent practices, they deliver predictable results and build trust with clients. Process mapping supports this goal by providing a clear reference for all team members.
Communication
Effective communication is essential for successful Six Sigma initiatives. Process mapping serves as a visual tool that helps team members understand workflows and share a common language. When teams see the steps and interactions in a process, they can discuss problems and solutions more easily.
Process mapping highlights roles and responsibilities, encourages teamwork, and enables tracking of changes. Teams from different functions collaborate better when they have a shared understanding of the process. This clarity leads to faster problem-solving and more effective decision-making.
Visual process maps foster dialogue and collaboration, making it easier for teams to address challenges together.
Clients benefit from improved communication because teams respond quickly to issues and keep everyone informed about changes. Systems that use process mapping often experience smoother project execution and better outcomes.
Efficiency
Efficiency stands as a core benefit of Six Sigma process mapping. Teams use process maps to streamline workflows and remove unnecessary steps. This approach helps organizations save time and resources. When teams visualize each activity, they spot overlapping tasks and clarify responsibilities. These actions reduce wasted effort and improve overall productivity.
Process mapping supports decision-making by providing a clear view of how work moves through a system. Leaders use these visual tools to make informed choices and address problems quickly. Documented workflows also help organizations meet compliance standards. Teams can show regulators exactly how processes operate, which reduces the risk of errors and penalties.
The table below highlights how process mapping enhances efficiency in business operations:
Benefit | Description |
|---|---|
Process mapping identifies overlapping tasks and clarifies responsibilities, reducing wasted time. | |
Supports Decision-Making | Provides a visual representation of workflows, enabling informed, data-driven decisions. |
Improves Compliance | Offers documented evidence of workflows, ensuring adherence to regulations and standards. |
Teams that review process maps regularly adapt to changing conditions. They update workflows to reflect new goals or requirements. This flexibility helps organizations stay competitive and efficient. Process mapping fosters a culture of innovation. Teams revisit and refine their workflows, searching for better ways to complete tasks.
Regular reviews of process maps help organizations respond to new challenges and maintain high levels of efficiency.
Thorough documentation allows precise management of business processes. Teams identify exceptions and understand why they occur. Clear process maps smooth hand-offs between departments and prevent bottlenecks. When everyone knows their role, work flows smoothly from one step to the next.
Teams document each step to manage processes with accuracy.
They identify exceptions and learn the reasons behind them.
Clear roles and responsibilities prevent bottlenecks and delays.
Organizations in manufacturing, healthcare, and service industries use process mapping to boost efficiency. They report faster turnaround times and lower operational costs. Teams that rely on process maps deliver consistent results and improve customer satisfaction. Efficiency gains also support long-term growth and stability.
Process mapping stands as a practical tool for driving efficiency. Teams that use it regularly find new opportunities to improve and sustain high performance. This approach helps organizations achieve their goals and maintain a competitive edge.
Types of Six Sigma Process Maps
SIPOC Map
A SIPOC map stands as one of the most popular tools in Six Sigma process mapping. SIPOC stands for Suppliers, Inputs, Process, Outputs, and Customers. This map gives teams a high-level view of a process from start to finish. They can see who provides the inputs, what those inputs are, the steps in the process, the outputs produced, and who receives them. SIPOC maps help teams understand the big picture before diving into details.
Feature/Benefit | Description |
|---|---|
High-level overview | SIPOC diagrams provide a comprehensive view of a process, including suppliers, inputs, process steps, outputs, and customers. |
Identification of inefficiencies | They help in quickly spotting bottlenecks, redundancies, and non-value-added activities. |
Communication tool | SIPOC diagrams facilitate collaboration among teams by providing a shared understanding of the process. |
Defect reduction | They assist in identifying sources of variation that can lead to defects. |
Alignment with goals | SIPOC diagrams help align project scope and goals with customer requirements and organizational objectives. |
Use Cases
Teams use SIPOC maps at the start of a Six Sigma project. They help define the scope and set clear boundaries. SIPOC maps work well when teams need to explain a process to new members or leadership. They also support projects that cross multiple departments. For example, a manufacturing team might use a SIPOC map to show how raw materials move from suppliers to finished products for customers. Healthcare teams use SIPOC maps to outline patient care steps from admission to discharge.
SIPOC maps help teams focus on what matters most. They make it easier to spot where problems might start and where improvements can have the biggest impact.
High-Level Map
A high-level process map shows the main steps in a workflow without going into detail. This map gives a broad overview, making it easy for leaders and stakeholders to understand the process. High-level maps do not require deep knowledge of every step. They help teams communicate the flow of work quickly.
Type of Process Map | Description | Purpose |
|---|---|---|
High-Level Process Map | Provides a broad overview without intricate details | Suitable for communication with leadership |
Detailed Process Map | Offers granular insights into specific steps | Used for in-depth analysis and problem-solving |
Overview
High-level maps are easy to create and update. Teams use them when they need to share information with people who do not need all the details. These maps help identify the main phases of a process and show how work moves from start to finish. For example, a high-level map of an order fulfillment process might include steps like "Receive Order," "Process Payment," "Pack Items," and "Ship Order."
High-level maps are useful for presentations and training.
They help teams set project boundaries and focus on key activities.
Detailed Map
A detailed process map breaks down every step in a workflow. This map shows exactly what happens at each stage. Teams use detailed maps to find problems, measure performance, and improve quality. Creating a detailed map takes more time and requires input from people who know the process well.
Step Analysis
Detailed maps allow teams to analyze each action, decision point, and handoff. They can see where errors happen and why delays occur. These maps support root cause analysis and help teams design better solutions.
Detailed maps are necessary for solving complex problems.
Teams use them to document best practices and train new staff.
They reveal hidden issues that high-level maps might miss.
Teams often start with a high-level map and then create a detailed map for deeper analysis. This approach ensures they understand both the big picture and the fine details.
Swimlane Map
Swimlane maps, also called cross-functional flowcharts, organize activities into parallel lanes. Each lane represents a department or a role within a process. Teams use swimlane maps to clarify who is responsible for each step. This visual tool helps everyone see how tasks move between different groups.
Swimlane diagrams make it easier to understand complex processes. They show where handoffs occur and highlight areas where delays might happen. Teams often use these maps to improve communication and reduce confusion about responsibilities.
Roles and Responsibilities
Swimlane maps play a key role in defining roles and responsibilities. They help teams see which department or person handles each part of a process. This clarity supports better teamwork and reduces mistakes.
Swimlane diagrams organize activities into lanes for different departments or roles.
Teams use these diagrams to visualize cross-functional processes and define responsibilities.
Swimlane maps help identify handoff points and spot inefficiencies between departments.
Teams in manufacturing, healthcare, and service industries rely on swimlane maps to improve coordination. When everyone understands their role, work flows smoothly from one step to the next. Swimlane maps also help managers find areas where tasks overlap or where bottlenecks slow progress. By addressing these issues, organizations can boost efficiency and maintain high quality.
Value Stream Map
Value stream mapping (VSM) gives teams a panoramic view of the entire workflow. This map shows every step from the beginning to the end of a process. Teams use VSM to find waste and improve the flow of value delivery.
Value stream maps help teams focus on activities that add value for customers. They highlight steps that do not contribute to the final product or service. By removing these non-value-added steps, organizations can increase efficiency and customer satisfaction.
Value-Added Steps
Value stream mapping helps teams identify which steps add value and which do not. Teams use this information to optimize processes and deliver better results.
VSM helps visualize processes and spot waste.
Teams use VSM to optimize the flow of value delivery.
Value stream mapping enhances efficiency and improves customer satisfaction.
VSM provides a panoramic view of the workflow, making it easier to spot obstacles and eliminate sluggishness.
Key metrics like lead time help teams measure efficiency and guide optimization efforts.
Teams often track lead time and cycle time to measure how quickly work moves through a process. By focusing on value-added steps, organizations can reduce delays and improve outcomes. Value stream maps support continuous improvement by helping teams revisit and refine their workflows. This approach leads to better performance and higher quality over time.
Process Map Creation Steps

Define Scope
Teams begin by defining the scope of the process map. They decide what part of the process to review and what they want to achieve. A clear scope sets boundaries and keeps the project focused. Teams state what the project will and will not include. They use quantifiable metrics to measure success. Scope statements support project objectives and account for time, budget, and resource limits. All key stakeholders review and approve the scope before mapping starts.
Tip: Regularly review the project charter to keep everyone focused on the original goals. Use a change control process for any proposed changes to the scope.
Key points for defining scope:
State project boundaries and objectives.
Include measurable goals.
Consider resources and limitations.
Get stakeholder approval.
Assemble Team
A successful process map requires a cross-functional team. Each member brings a unique perspective and expertise. Teams include process owners, subject matter experts, and representatives from every department involved. A neutral facilitator guides mapping sessions and maintains objectivity.
Role Type | Description |
|---|---|
Process Owners | Individuals with direct responsibility for the process. |
Subject Matter Experts | Experts with deep knowledge of specific areas. |
Department Representatives | Members from all departments that interact with the process. |
Neutral Facilitator | Unbiased individual who guides mapping sessions. |
Teams may also include operators, engineers, quality assurance experts, maintenance technicians, logistics personnel, customer service representatives, and suppliers. This diverse group ensures that all aspects of the process are considered.
Note: Including team members with hands-on experience helps capture real-world details and identify practical improvements.
Document Steps
Teams document each step of the process in detail. They use flowcharts, SIPOC diagrams, and deployment flowcharts to visualize the workflow. Flowcharts break down the process into individual steps for better understanding. SIPOC diagrams provide a high-level overview, showing suppliers, inputs, process steps, outputs, and customers. Deployment flowcharts highlight the roles of different departments and help teams find areas of waste.
Flowchart Type | Description |
|---|---|
Deployment Flowchart | Shows roles of departments and stakeholders, emphasizing efficiency and waste reduction. |
Alternate Path Flowchart | Displays alternate paths for steps, helping to spot redundancies and bottlenecks. |
SIPOC Diagram | Outlines key elements for a comprehensive understanding of the process. |
Teams sequence the steps from start to finish and use standard symbols to represent actions, decisions, and handoffs. They review the documented steps for accuracy and completeness.
Teams that document steps carefully create a strong foundation for analysis and improvement.
Choose Map Type
Teams select the most suitable process map based on their goals and the complexity of the workflow. Each map type serves a different purpose. For example, a SIPOC map gives a broad overview, while a detailed process map breaks down every step. Swimlane diagrams clarify roles and responsibilities, and value stream maps focus on value-added activities.
When choosing a map type, teams consider the following:
The level of detail needed for analysis.
The audience for the map, such as leadership or frontline staff.
The process complexity and number of departments involved.
The main objective, like identifying waste or clarifying handoffs.
Map Type | Best Use Case | Key Benefit |
|---|---|---|
SIPOC | High-level overview, project scoping | Clarifies suppliers and customers |
High-Level Map | Communicating main steps to leadership | Quick understanding |
Detailed Map | In-depth analysis and problem-solving | Reveals hidden issues |
Swimlane Diagram | Cross-functional processes, clarifying roles | Defines responsibilities |
Value Stream Map | Lean projects, waste identification | Focuses on value-added steps |
Teams often start with a high-level or SIPOC map, then move to detailed or swimlane maps as they dig deeper. This approach ensures they match the map type to the project’s needs and audience.
Tip: Teams should revisit their choice of map type as the project evolves. Sometimes, a different map provides better insights during later stages.
Validate with Stakeholders
Validation with stakeholders ensures the process map reflects reality and meets project goals. Teams involve process owners, subject matter experts, and anyone affected by the workflow. This step helps catch errors, fill gaps, and build support for changes.
Key strategies for stakeholder validation include:
Strategy | Description |
|---|---|
Engage process owners and team members in reviewing maps to ensure accuracy and completeness. | |
Regular Updates | Maintain updates to reflect changes in stakeholder relationships and project conditions. |
Teams also use these practical actions:
Cross-reference the map with project documents.
Validate stakeholder positions and roles.
Review relationship connections between departments.
Check the completeness of information.
Confirm the map’s visual clarity.
Stakeholder validation helps teams avoid misunderstandings and ensures everyone agrees on the process. Regular updates keep the map current as projects progress or teams change.
Note: Early and frequent stakeholder involvement leads to smoother implementation and better results.
Analyze for Improvement
After validation, teams analyze the process map to find opportunities for improvement. They look for bottlenecks, redundancies, and steps that do not add value. Teams use data from the map to guide their analysis and set priorities.
Common analysis techniques include:
Identifying steps that cause delays or errors.
Measuring cycle times and handoff points.
Comparing the current process to best practices.
Using metrics like defects per unit or process yield.
Teams often hold workshops to brainstorm solutions and test ideas. They document findings and propose changes that align with project goals. This analysis leads to targeted improvements, higher quality, and greater efficiency.
Teams that analyze process maps regularly discover new ways to optimize workflows and sustain long-term success.
Implement and Monitor
Teams move forward by putting their process map improvements into action. They follow a structured approach to ensure changes deliver quality results and boost efficiency. Implementation begins with clear communication. Each team member receives instructions about new steps and responsibilities. Leaders provide training and resources to support the transition.
Key steps for successful implementation:
Assign roles for each process step.
Deliver training sessions to explain new procedures.
Update documentation to reflect changes.
Set up tools and systems needed for new workflows.
Launch the improved process in a controlled environment.
Tip: Teams often use pilot programs to test changes before full-scale rollout. This method helps identify issues early and allows for quick adjustments.
After implementation, teams monitor the process to measure success. They track performance using key metrics such as cycle time, defect rates, and output quality. Regular reviews help teams spot problems and maintain improvements.
Monitoring Activity | Purpose | Example Metric |
|---|---|---|
Performance Tracking | Measure process efficiency and quality | Cycle Time |
Data Collection | Gather evidence of improvement | Defect Rate |
Feedback Sessions | Identify challenges and opportunities | Employee Suggestions |
Audit Reviews | Ensure compliance and consistency | Process Adherence |
Teams use visual tools like control charts and dashboards to display results. These tools make it easy to see trends and spot deviations. Leaders encourage team members to report issues and suggest further improvements.
Continuous monitoring keeps the process stable. Teams schedule regular audits and update process maps as needed. They celebrate successes and share lessons learned across departments. This approach builds a culture of ongoing improvement and helps organizations maintain high standards.
Note: Effective implementation and monitoring ensure that process changes lead to lasting quality and efficiency. Teams that stay engaged and proactive achieve the best results.
Continuous Improvement with Process Mapping
Continuous improvement relies on a cycle of learning, adapting, and refining processes. Teams use Six Sigma Process Mapping to support ongoing improvement by making workflows visible and actionable. This approach helps organizations respond quickly to changes and maintain high standards.
Integrate into Operations
Teams embed process mapping into daily operations to create a foundation for improvement. They update maps as workflows evolve, ensuring that documentation matches reality. Leaders encourage regular reviews of process maps to identify new opportunities for efficiency. When teams integrate mapping into their routines, they build a culture that values transparency and adaptability.
Regular integration of process mapping leads to measurable gains in efficiency and financial performance.
Evidence Type | Description |
|---|---|
Financial Returns | 55% of organizations reported returns between $100,000 to $500,000 per BPM project. |
Operational Efficiency | Companies reducing cycle times achieved a 20-50% increase in process efficiency. |
Organizations that use process mapping as part of their operations often see faster cycle times and improved resource allocation. These improvements support long-term growth and stability.
Train Teams
Training helps teams understand how to use process maps effectively. Leaders provide workshops and hands-on sessions to teach mapping techniques. Employees learn to document steps, analyze workflows, and suggest improvements. Training also covers how to use mapping tools and symbols, making it easier for everyone to participate.
Workshops introduce mapping concepts and best practices.
Hands-on activities build confidence and skill.
Ongoing support encourages employees to use process maps in problem-solving.
Teams that receive regular training adapt quickly to new processes and maintain consistency. This investment in education supports a proactive approach to quality and efficiency.
Use Data for Improvement
Teams collect and analyze data from process maps to guide decision-making. They track metrics such as cycle time, defect rates, and customer satisfaction. Data-driven analysis helps teams pinpoint areas for improvement and measure the impact of changes.
Evidence Type | Description |
|---|---|
Customer Satisfaction | Improved process efficiency correlates with enhanced customer satisfaction and reduced costs. |
Financial Returns | Some companies reported even higher returns through systematic process optimization approaches. |
Teams use dashboards and reports to share results with stakeholders. Data from process mapping supports continuous improvement by highlighting trends and revealing hidden issues. Leaders encourage teams to use this information to refine workflows and sustain high performance.
Data-driven improvement ensures that changes deliver real value for customers and the organization.
Continuous improvement with process mapping creates a cycle of learning and growth. Teams that integrate mapping into operations, invest in training, and use data effectively achieve lasting quality and efficiency.
Six Sigma process mapping helps teams achieve quality and efficiency by making workflows clear and easy to understand. Visual tools allow teams to spot waste and improve each step. Teams who use these methods see better results and more consistent performance.
Visualizing workflows supports ongoing improvement.
Reducing waste leads to higher quality.
For more details or support with Six Sigma process mapping, readers can contact our team to continue their learning journey.
FAQ
What is Six Sigma process mapping?
Six Sigma process mapping shows each step in a workflow. Teams use it to find problems and improve quality. This tool helps everyone see how work moves from start to finish.
Why do teams use process maps?
Teams use process maps to spot waste, reduce errors, and make work easier. These maps help people understand their roles and improve how tasks get done.
Which industries benefit most from Six Sigma process mapping?
Manufacturing, healthcare, and service industries see strong results with Six Sigma process mapping. They use it to boost efficiency, cut costs, and improve customer satisfaction.
How does process mapping help reduce waste?
Process mapping highlights steps that do not add value. Teams remove these steps to save time and resources. This leads to faster workflows and lower costs.
What are common types of Six Sigma process maps?
Teams use SIPOC maps, high-level maps, detailed maps, swimlane diagrams, and value stream maps. Each type serves a different purpose and helps teams solve specific problems.
Who should be involved in creating a process map?
A cross-functional team works best. This group includes process owners, subject matter experts, and department representatives. Each person shares knowledge to build an accurate map.
How often should teams update process maps?
Teams should review and update process maps regularly. Changes in workflow, technology, or goals may require new maps. Frequent updates keep processes efficient and accurate.
Can process mapping improve communication?
Yes! Process mapping gives everyone a clear view of the workflow. Teams use maps to discuss problems, share ideas, and work together to find solutions.


