How to Improve Business Processes with Six Sigma Mapping

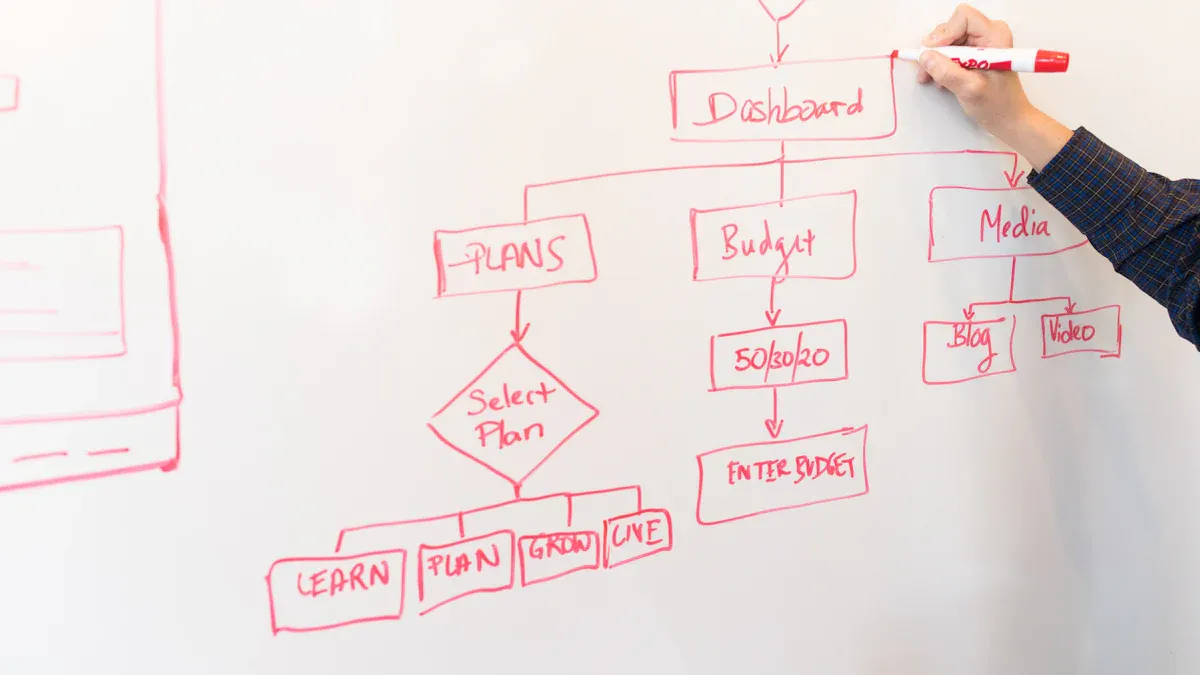
Six Sigma Process Mapping gives teams a clear way to see how work gets done. Visual process maps help people quickly gain knowledge about each step, making training more effective. Teams often use these maps to spot waste and ask important questions about roles and timing.
Standardized symbols and clear labels help everyone understand the process, from Business Management to Sales.
Involving cross-functional teams builds consensus and strengthens collaboration.
Process mapping leads to better communication and smoother improvement projects.
Key Takeaways
Six Sigma Process Mapping visually shows every step in a business process, helping teams understand workflows clearly.
Using standardized symbols and involving cross-functional teams improves communication and collaboration.
Process maps help identify inefficiencies, waste, and bottlenecks, enabling targeted improvements that boost quality and efficiency.
Different types of maps like SIPOC, flowcharts, value stream maps, and swimlane diagrams serve unique purposes in analyzing and improving processes.
Following the DMAIC phases with process mapping guides teams to define, measure, analyze, improve, and control processes effectively.
Accurate and regularly updated process maps support better decision-making and sustain long-term improvements.
Engaging stakeholders and using the right technology tools enhance teamwork, training, and smooth implementation of changes.
Monitoring key metrics after improvements ensures processes stay on track and helps teams adjust quickly for continued success.
Six Sigma Process Mapping
Definition
Six Sigma Process Mapping is a graphical, visual representation of the steps, inputs, outputs, and decision points within a business process. According to the International Six Sigma Institute, this mapping acts as a roadmap for business operations. It helps stakeholders see the sequence and flow of activities, standardize tasks, and drive continuous improvement. Teams use process maps to identify inefficiencies, defects, and opportunities for improvement. Common types include flowcharts and swimlane diagrams, which show the roles of different departments or stakeholders. These maps can display both the current state and the ideal future state of a process. Tools such as SIPOC diagrams, flowcharts, and value stream maps help clarify relationships between suppliers, inputs, process steps, outputs, and customers.
Purpose
The main purpose of Six Sigma Process Mapping is to support business process improvement. Teams use mapping to:
Define opportunities for improvement by identifying process issues.
Measure current process performance to set benchmarks.
Analyze the process to find defects and root causes.
Improve the process by addressing these root causes.
Control the improved process to maintain and monitor performance.
This structured approach helps teams visualize where defects and inefficiencies occur. It enables targeted improvements that optimize processes, reduce variation, and increase customer satisfaction.
Tip: Process mapping provides a step-by-step view of workflows, making it easier for teams to spot bottlenecks, redundancies, and waste.
Key Benefits
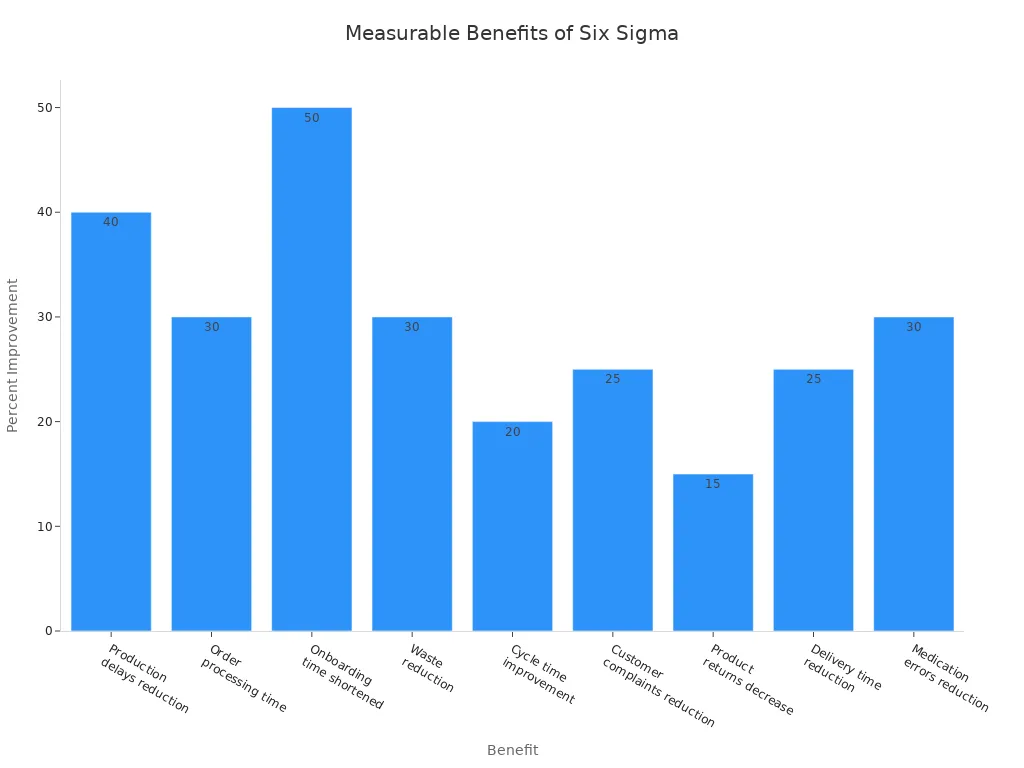
Six Sigma Process Mapping offers many measurable and qualitative benefits for organizations. Teams often see:
Benefit | Measurable Impact |
|---|---|
Reduction in production delays | |
Decrease in order processing time | 30% faster through automation |
Shortened onboarding time | Reduced from 10 days to 5 days |
Waste reduction | 30% less waste generated |
Cycle time improvement | 20% faster cycle times |
Customer complaints reduction | 25% fewer complaints |
Product returns decrease | 15% fewer returns |
Delivery time reduction (logistics) | 25% faster deliveries |
Medication errors reduction (healthcare) | 30% fewer undetected errors |
Six Sigma Process Mapping also improves communication by creating a shared visual understanding of workflows. This reduces miscommunication and delays. Teams and departments collaborate more effectively, leading to smoother operations. Process maps clarify roles and responsibilities, which increases accountability and reduces errors. For example, hospitals that use process maps have standardized procedures and fewer medication errors. These improvements lead to faster cycle times, less waste, and higher customer satisfaction.
Teams can use different types of process maps to reveal roles, responsibilities, and value-adding steps.
Value Stream Mapping highlights where value is added and where waste occurs, providing data on time, resources, and flow efficiency.
The DMAIC methodology guides teams to systematically eliminate waste and maximize value delivery.
Note: Visual process maps act as powerful communication tools. They foster collaboration, create a common understanding, and support continuous improvement efforts.
Process Mapping in DMAIC
Define Phase
In the Define phase, teams use process mapping to create a clear picture of the current process. Tools such as SIPOC charts, flowcharts, and swimlane diagrams help visualize the sequence of activities, the flow of information, and the interactions between departments. These maps show the major steps, inputs, outputs, and stakeholders involved. By laying out the process visually, teams can define the boundaries and scope of the project. This step ensures everyone understands what the process includes and where it starts and ends.
A high-level process map acts as a blueprint. It outlines the workflow and highlights key steps, making it easier to spot potential problem areas. SIPOC diagrams, for example, identify suppliers, inputs, process steps, outputs, and customers. This clarity helps align stakeholders and sets a strong foundation for improvement. When everyone sees the same process map, communication improves and confusion decreases. Teams can then agree on the problem statement, project goals, and the scope of the improvement effort.
Tip: Creating a process map early in the Define phase helps teams avoid misunderstandings and ensures that everyone works toward the same objectives.
Measure Phase
During the Measure phase, process mapping becomes a tool for collecting accurate data. Teams use detailed maps to break down the process into steps, showing the flow from input to output. This step-by-step view helps identify where to focus data collection efforts.
Process maps display each action, input, and output in order.
They reveal relationships between process variables, such as which inputs (X) affect which outputs (Y).
Teams use these maps to spot inefficiencies, bottlenecks, and waste.
The maps guide the creation of a Data Collection Plan, specifying what data to collect, where to collect it, and how to ensure accuracy.
A detailed process map highlights critical points where variation or waste may occur. By focusing on these points, teams can gather data that truly reflects the current state. This approach supports measurement system analysis and ensures that the data collected is reliable. The Measure phase ends with a process map and a set of data that show how well the process meets customer needs or business goals.
Analyze Phase
In the Analyze phase, teams use process maps to dig deeper into the causes of problems. The maps show each step, input, and output, making it easier to visualize where issues might arise. Teams look for value-added and non-value-added activities, using tools like value stream mapping to spot inefficiencies.
Several analytical techniques help teams find root causes:
Fishbone diagrams (Ishikawa diagrams) organize possible causes into categories.
Brainstorming and the 5 Whys method help teams ask questions and trace problems to their source.
Statistical tools, such as regression analysis and hypothesis testing, measure the impact of different variables on process outcomes.
Waste analysis targets common types of waste, such as overproduction, waiting, or defects.
By combining these techniques, teams can prioritize which problems to solve first. They identify the most critical inputs and focus on changes that will have the biggest impact. Process mapping in the Analyze phase turns data and observations into actionable insights, setting the stage for real improvement.
Improve and Control Phases
During the Improve phase, teams use process maps to design and implement better ways of working. They start by reviewing the “As-Is” process map. This map shows the current process and highlights steps that cause problems or do not add value. By studying this map, teams can see exactly where to make changes. They then create a “Future State” process map. This new map outlines the improved process, showing how work will flow after changes take place.
Process maps help teams plan solutions. They make it easier to see how each change will affect the process. Teams can test new ideas and predict results before making changes in real life. This approach reduces risk and helps teams avoid mistakes. When everyone sees the improved process map, they understand what will change and why. This shared understanding supports better teamwork and smoother implementation.
Process maps also play a key role in communication and training. Teams use them to explain new workflows to employees and stakeholders. Visual maps make it easier for people to learn new steps and follow the updated process. This reduces confusion and speeds up the transition to the improved way of working.
As the project moves into the Control phase, process maps continue to provide value. The updated process map becomes a reference for monitoring performance. Teams use it to check if the new process works as planned. If problems appear, they can quickly find the step where things went wrong. This helps maintain the gains achieved during the Improve phase.
Process maps also support control and transition plans. They help process owners understand their responsibilities and keep the process on track. Teams often use process maps as part of visual management systems. These systems make it easy to spot issues and take action before small problems grow.
Process maps evolve from showing the current state to illustrating the future state.
They help teams identify and remove non-value added activities.
Visual maps support communication, training, and stakeholder engagement.
Teams use process maps to prepare for hand-off to process owners.
Process maps are essential tools for sustaining improvements over time.
By using process maps throughout the Improve and Control phases, organizations can lock in their gains and build a culture of continuous improvement.
Types of Process Maps
SIPOC
A SIPOC diagram gives teams a high-level view of a process by mapping Suppliers, Inputs, Process steps, Outputs, and Customers. This tool helps teams understand the full scope of a process before diving into details. SIPOC diagrams support the Define phase in Six Sigma projects by clarifying who provides what, what resources are needed, and who receives the results.
Use Cases
Teams use SIPOC diagrams when they need to:
Define project boundaries and scope.
Align goals with customer requirements.
Identify all stakeholders and resources involved.
Improve communication among departments.
Lay the groundwork for further process analysis.
SIPOC diagrams work best at the start of a project. They help everyone see the big picture and agree on what the process includes.
Creation Steps
To create a SIPOC diagram, teams follow these steps:
List the Process: Identify 5-7 high-level steps that make up the process.
Identify Outputs: Define the products, services, or deliverables produced.
Identify Customers: List who receives the outputs, either inside or outside the organization.
Identify Inputs: Determine what resources, materials, or information the process needs.
Identify Suppliers: Name the entities that provide these inputs.
Description | Purpose in Six Sigma Process Mapping | |
|---|---|---|
Suppliers | Entities providing necessary inputs to the process | Identify who provides inputs, ensuring understanding of upstream sources |
Inputs | Resources, materials, or information required for the process | Clarify what is needed to execute the process effectively |
Process | Series of high-level steps (typically 5-7) transforming inputs into outputs | Map the core activities to understand and analyze the process flow |
Outputs | Products, services, or deliverables generated by the process | Define measurable results aligned with customer requirements |
Customers | Recipients or beneficiaries of the outputs (internal or external) | Ensure outputs meet customer needs and expectations |
Tip: SIPOC diagrams foster shared understanding and help teams spot inefficiencies or sources of variation early.
Flowchart
Flowcharts show the sequence of steps in a process using symbols and arrows. These diagrams make complex processes easier to understand and improve. Teams use flowcharts to document, communicate, and analyze workflows, which supports problem-solving and process improvement.
Symbols
Flowcharts use standard symbols to represent different actions:
Oval: Start or end point.
Rectangle: Process step or action.
Diamond: Decision point.
Arrow: Direction of flow.
Maintaining a consistent visual language helps everyone interpret the chart quickly.
Best Practices
Teams should follow these best practices when creating flowcharts:
Use clear, simple symbols and labels.
Align elements neatly and avoid crossing lines.
Space out steps for easy reading.
Limit the number of steps on one page.
Review the chart with team members for accuracy.
Flowcharts help teams visualize the flow of work, spot bottlenecks, and identify non-value-added activities. They also improve communication by providing a clear, standardized view of the process.
Value Stream Map
A Value Stream Map (VSM) gives a detailed look at how value flows through a process. This map highlights every step, from start to finish, and shows where waste occurs. Teams use VSMs to analyze workflows, reduce waste, and design better future states.
Waste Identification
Value Stream Maps help teams find and eliminate waste by:
Showing each process step and the flow of materials and information.
Highlighting inventory points, cycle times, and defect rates.
Identifying the seven types of waste, such as waiting, overproduction, and defects.
Teams use this information to target non-value-adding activities and improve efficiency.
Current vs. Future State
Teams first create a "current state" VSM to capture how the process works now. They then design a "future state" map to show how the process should work after improvements. This comparison helps teams:
Set goals for cycle time, lead time, and quality.
Plan changes that increase value and reduce waste.
Track progress and measure results over time.
Value Stream Mapping supports continuous improvement by providing a clear baseline and helping teams focus on what matters most to customers.
Swimlane Diagram
Swimlane diagrams provide a powerful way to visualize business processes. These diagrams use horizontal or vertical lanes to separate tasks by role, department, or team. Each lane represents a specific entity responsible for certain steps in the process. This structure makes it easy to see who does what and when.
Roles
Swimlane diagrams assign clear roles to each part of a process. By dividing the process into lanes, teams can see which department or individual handles each task. This approach reduces confusion and increases accountability. For example, in a customer support process, one lane might represent the customer, another the support agent, and others the technical team or quality assurance.
Swimlane diagrams answer the question, "Who is responsible for this step?" at every point in the process.
Key ways swimlane diagrams clarify roles include:
Each lane shows the tasks assigned to a specific role, department, or team.
The diagram makes it clear who owns each action or decision.
Teams can see handoffs between roles, which helps track responsibility shifts.
The structure highlights dependencies, so everyone knows when their input is needed.
By showing all roles together, the diagram supports better teamwork and communication.
A swimlane diagram often serves as a training tool. New employees can quickly learn their responsibilities by following their lane. Managers use these diagrams to explain processes and set expectations.
Cross-Functional Clarity
Many business processes cross multiple departments or teams. Swimlane diagrams bring clarity to these complex workflows. They show how work moves from one function to another, making it easier to spot delays or miscommunication.
A swimlane diagram improves cross-functional clarity in several ways:
It delineates responsibilities across departments, teams, or individuals.
It highlights interactions and handoffs between different functions.
It exposes bottlenecks and redundancies that slow down the process.
It improves communication by making each step and transition visible.
It documents the process for future reference and training.
For example, in an order fulfillment process, the diagram might include lanes for sales, warehouse, and shipping. Each lane contains the tasks for that department. The diagram shows how the order moves from sales to warehouse to shipping, with clear handoffs at each stage.
Teams use swimlane diagrams to foster alignment and collaboration. When everyone sees the full process, they can work together to remove obstacles and improve efficiency.
Swimlane diagrams also help identify areas for improvement. By making handoffs and dependencies visible, teams can target specific steps for streamlining. This leads to faster processes, fewer errors, and better results for customers.
Creating a Process Map
Define Scope
Defining the scope sets the foundation for successful Six Sigma Process Mapping. Teams begin by clarifying the purpose of the process map. They decide what they want to achieve, such as improving efficiency or reducing errors. Next, they select the process or subprocess to review. This step involves determining the boundaries, including where the process starts and ends. Teams then choose the level of detail needed to meet their objectives. Some maps show only high-level steps, while others include every task and decision point.
A well-defined scope helps teams focus their efforts and select the right type of process map.
Steps for Defining Scope:
Select the process or subprocess to be reviewed.
Decide on the level of detail required.
A clear scope guides the mapping process and ensures that teams address the most important areas.
Gather Team and Data
Teams need accurate information and the right people to create a reliable process map. Collaboration with stakeholders provides detailed insights and addresses different perspectives. Subject matter experts (SMEs) offer deep knowledge about the process. Stakeholders understand the steps, timelines, and resources involved.
Teams identify all tasks and assign responsible roles. They note the resources needed for each task, including tools, information, and materials. Data sources such as documents, metrics, and materials help teams capture the current state. Expert input reveals problem areas like bottlenecks and redundancies.
Sharing the process map with stakeholders for feedback ensures accuracy and keeps the map current.
Key actions for gathering team and data:
Involve SMEs and stakeholders who know the process well.
Use data sources like documents, metrics, and materials.
Document all tasks, inputs, and outputs for each step.
Capture relationships and dependencies between steps.
Refine the map based on stakeholder feedback.
Teams document inputs required for each step, such as forms or data. They also capture outputs, including deliverables like invoices or updated records. Clear descriptions and symbols help represent activities and data flows.
Select Tools
Selecting the right tools makes process mapping easier and more effective. Teams choose tools based on the scope, complexity, and collaboration needs. Many organizations use digital platforms for Six Sigma Process Mapping, which allow real-time editing and sharing. Online tools support remote collaboration and make it simple to update maps as processes change.
Tool Type | Features | Best Use Case |
|---|---|---|
Flowchart Software | Drag-and-drop symbols, templates | Simple workflows |
SIPOC Templates | Pre-built structure for SIPOC | High-level process overview |
Value Stream Mapping Tools | Time tracking, waste analysis | Detailed process improvement |
Collaboration Platforms | Real-time editing, comments | Team-based mapping |
Teams use standardized symbols to ensure everyone understands the map. Digital tools often include libraries of symbols and templates. These features help teams create clear, accurate maps and support ongoing collaboration.
Choosing the right tool streamlines the mapping process and improves team engagement.
Map Steps
Mapping steps forms the core of Six Sigma Process Mapping. Teams start by setting clear start and end points for the process. They then break down the process into individual steps, using standard symbols to represent actions, decisions, and flows. This visual approach helps everyone understand how work moves from one stage to the next.
Step-by-step process for mapping:
List Each Step
Teams write down every action that takes place in the process. They include tasks, decisions, and handoffs between people or departments.Sequence the Steps
Teams arrange the steps in the order they happen. They use arrows to show the direction of flow. This makes it easy to follow the process from start to finish.Add Inputs and Outputs
For each step, teams identify what goes in (inputs) and what comes out (outputs). This could be information, materials, or approvals.Use Standard Symbols
Teams use shapes like rectangles for actions, diamonds for decisions, and ovals for start or end points. These symbols create a common language for everyone.Show Roles and Responsibilities
Teams can use swimlane diagrams to show who does each step. Each lane represents a person, team, or department. This adds clarity and accountability.Highlight Key Metrics
Teams may add data such as cycle time, wait time, or defect rates next to each step. This helps spot where delays or problems occur.
Teams often use digital tools for mapping. These tools allow real-time editing and easy sharing, which supports collaboration and keeps maps up to date.
Types of process maps used:
Simple-drawing maps: Use basic boxes and arrows for quick sketches.
SIPOC maps: Give a high-level summary of suppliers, inputs, process steps, outputs, and customers.
Flowcharts: Show detailed steps and decisions.
Flow process charts: Help find non-value-added activities.
Value stream maps: Analyze waste and set improvement priorities.
A clear process map helps teams see the entire workflow. It makes it easier to find steps that do not add value or cause delays. Teams can then focus on improving these areas.
Mapping steps visually supports Lean Six Sigma by making processes easy to understand and analyze. This approach helps teams identify defects, inefficiencies, and opportunities for improvement.
Analyzing Process Maps

Identify Inefficiencies
Teams use process maps to spot where business processes slow down or waste resources. A process map gives a clear, visual layout of each step, making it easier to see problems that might not appear in written descriptions. Teams often start by interviewing process owners to gather firsthand knowledge. They document each step, then test the process from start to finish to check if actual practices match what is on paper.
To identify inefficiencies, teams follow a structured approach:
Define the scope and goal of the process map.
Gather detailed information through interviews, observations, and data collection.
Draw the process map, showing steps, decisions, and interactions.
Validate the map with stakeholders to ensure accuracy.
Analyze the map for bottlenecks, delays, or redundant steps.
Use the map as a tool for real-time discussion and modification.
Process mapping stands out because it allows teams to make quick changes and see the impact immediately. This visual method helps teams communicate better and find waste or duplication faster than long written reports.
Detailed process maps also support advanced tools like robotic process automation, which require step-by-step clarity. By using mapping software and expert input, teams can improve the accuracy and objectivity of their analysis.
Root Cause Analysis
After finding inefficiencies, teams need to understand why these problems happen. Root cause analysis helps teams dig deeper and solve the real issues, not just the symptoms. Process maps play a key role in this step by showing how each part of the process connects.
Teams often use tools like Fishbone (Ishikawa) diagrams and the 5 Whys method. They start by defining the problem clearly and collecting data about the process. The Fishbone diagram helps organize possible causes into categories such as Machinery, Manpower, Materials, Methods, Measurement, and Environment. Teams then analyze the process map and data to spot patterns or points where things go wrong.
Involving stakeholders and subject matter experts brings different viewpoints, which helps uncover hidden causes. Teams use the process map to visualize the flow and pinpoint where bottlenecks or errors occur.
Once the root cause is found, teams develop and implement solutions. They monitor results to make sure the problem does not return.
Prioritize Improvements
Not every problem can be fixed at once. Teams must decide which improvements will have the biggest impact. They start by understanding the context behind each idea, documenting both the current state and the proposed changes. Teams compare these ideas to company standards and goals.
A common method is to use an Effort vs. Impact chart. This tool helps teams rank improvements based on how much effort they require and the value they deliver. Teams also consider factors such as customer satisfaction, cost reduction, compliance, and error reduction.
Prioritization Criteria | Description |
|---|---|
Impact | How much the change will benefit the process or customer |
Feasibility | How easy it is to make the change |
Urgency | How quickly the change needs to happen |
Resources | What people, time, or money are needed |
Risk | What could go wrong if the change is made |
Teams use frameworks like the Pareto principle or Eisenhower matrix to rank opportunities. They focus on improvements that are specific, measurable, achievable, relevant, and time-bound (SMART).
By following these steps, teams ensure that their efforts lead to meaningful and lasting process improvements.
Implementing Improvements
Action Plans
A strong action plan guides teams through the process improvement journey. Teams start by setting clear objectives that define what they want to achieve. They use detailed process maps to visualize current workflows and separate value-added from non-value-added activities. Data collection and analysis help teams understand how the process performs and where bottlenecks exist. Root cause analysis uncovers the real issues behind problems, not just the symptoms.
Teams then develop targeted solutions based on data. They create an implementation plan that includes timelines, resource allocation, and backup plans. Monitoring and control measures track progress and help sustain improvements. Employee training and communication build skills and encourage buy-in. Teams often use Six Sigma methods like DMAIC and PDCA cycles to structure their efforts. Change management strategies, such as involving stakeholders and addressing resistance, support smooth transitions. Documentation and regular audits ensure that improvements last. Cross-functional teams and digital tools help manage control plans and drive operational excellence.
Key components of an effective action plan:
Map current processes in detail.
Collect and analyze relevant data.
Perform root cause analysis.
Develop targeted improvement strategies.
Plan implementation with timelines and resources.
Establish monitoring and control measures.
Train and communicate with employees.
Apply Six Sigma methodologies.
Use change management strategies.
Maintain documentation and conduct audits.
Leverage cross-functional teams and software tools.
A well-structured action plan keeps everyone focused and increases the chances of lasting success.
Stakeholder Engagement
Engaging stakeholders is essential for successful process improvement. Teams must inform, involve, and motivate everyone affected by the changes. The table below shows different ways to engage stakeholders and examples of each approach:
Engagement Outcome | Description | Example of Application |
|---|---|---|
Informing | Keep stakeholders updated about changes. | Educating staff about new referral options. |
Understanding | Learn about stakeholder needs and barriers. | Adding feedback questions to learn about user challenges. |
Verifying | Confirm ideas with stakeholders. | Using toolkits to validate approaches early. |
Enrolling | Motivate stakeholders to participate. | Monthly meetings to co-create materials. |
Accessing | Use stakeholder expertise and resources. | Collaborating with providers for technical insights. |
Doing | Involve stakeholders in implementation. | Outreach visits to reduce resistance. |
Teams should remain flexible and adapt engagement strategies based on feedback. Early and ongoing participation helps secure buy-in. Tracking interactions with engagement software ensures clear communication. Setting measurable engagement goals and providing regular updates keeps stakeholders informed and motivated.
Best practices for stakeholder engagement:
Involve stakeholders from the start.
Track communication and interactions.
Set clear engagement goals.
Provide regular, transparent updates.
Effective engagement builds trust and helps teams overcome resistance to change.
Monitor and Adjust
Monitoring improvements ensures that changes deliver the expected results. Teams track key metrics such as process time, quality, employee satisfaction, and return on investment. Compliance rates and recurrence of issues show if new processes are followed and if problems return. Training effectiveness and user adoption rates indicate how well employees adjust to changes.
Important metrics to monitor:
Process time (cycle time) for efficiency.
Quality metrics like error counts and customer complaints.
Employee satisfaction through surveys.
Return on investment and cost savings.
Recurrence rates of previous issues.
Training and awareness levels.
Customer or stakeholder feedback.
Teams use real-time dashboards and feedback loops to collect and analyze data. Continuous monitoring allows for quick adjustments if problems arise. Technology helps teams gather information and make informed decisions. Regular reviews and updates foster a culture of continuous improvement.
Ongoing monitoring and adjustment keep process improvements on track and support long-term success.
Best Practices
Team Involvement
Strong team involvement drives successful Six Sigma process mapping. Teams work best when they include people with different skills, backgrounds, and viewpoints. This diversity helps challenge assumptions and brings fresh ideas to the table. Teams should include both those who work directly in the process and those from outside. People inside the process offer valuable insights, while outsiders can spot hidden issues and question existing habits.
A structured approach keeps everyone engaged and focused. The team leader, often a Green Belt or Black Belt, prepares meetings by setting agendas and sharing updates. Meetings start with introductions and a review of past action items. Every member gets a chance to share ideas, and leaders encourage quieter voices to speak up. Teams document key decisions and next steps before ending each meeting.
Key steps for effective team involvement:
Include both process insiders and outsiders.
Use strong facilitation and clear agendas.
Start meetings with updates and introductions.
Review previous actions and open questions.
Encourage input from all members.
Record decisions and action items.
End with a summary and next steps.
Teams also benefit from tools like SIPOC diagrams, RACI matrices, and skills matrices. These tools clarify roles, responsibilities, and strengths, making teamwork more effective.
Map Accuracy
Accurate process maps form the backbone of any improvement effort. Teams must avoid oversimplifying or skipping steps, as missing details can hide real problems. Using a consistent set of symbols and clear labels helps everyone understand the map. Teams should involve the right stakeholders, especially those who know the process well, to capture every important step.
Regular reviews keep maps up to date. Teams treat process maps as living documents, updating them as workflows change. Breaking down complex processes into smaller parts makes maps easier to follow. Teams should test maps in real situations to find gaps or unclear steps.
Teams that review and update their maps regularly maintain higher accuracy and support better decision-making.
Tips for maintaining map accuracy:
Use consistent symbols and notation.
Involve knowledgeable stakeholders.
Break down complex processes.
Review and update maps often.
Test maps in real-world scenarios.
Keep maps clear and easy to follow.
Technology Tools
Modern technology tools make process mapping faster and more collaborative. Platforms like Creately, Microsoft Visio, GitMind, Canva, Cacoo, and Visme offer ready-made templates and drag-and-drop features. These tools support real-time collaboration, so teams can work together even when they are not in the same room. Cloud-based synchronization keeps maps updated and accessible to everyone.
These platforms handle many types of process maps, including flowcharts, swimlane diagrams, value stream maps, and SIPOC diagrams. Integration with other applications helps teams share information and track progress. Visualization features make it easier to spot problems and communicate solutions.
Tool | Key Features | Best Use Case |
|---|---|---|
Creately | Real-time collaboration, templates | Team-based mapping |
Microsoft Visio | Drag-and-drop, integration | Detailed process diagrams |
GitMind | Cloud sync, easy sharing | Remote teams |
Canva | Visual templates, simple editing | Quick visual maps |
Cacoo | Collaborative editing, diagrams | Cross-functional teams |
Visme | Infographics, data visualization | Presentations and reports |
Choosing the right technology tool boosts clarity, teamwork, and continuous improvement in Six Sigma projects.
Six Sigma Process Mapping helps organizations improve business processes by making each step clear and easy to follow. Teams gain lasting benefits, such as better quality, higher efficiency, and a culture of continuous improvement. The table below shows how these improvements support long-term success:
Explanation | |
|---|---|
Enhanced Quality Control | Reduces mistakes and raises product quality. |
Increased Efficiency | Removes bottlenecks and boosts productivity. |
Cost Reduction | Cuts waste and lowers costs. |
Improved Customer Satisfaction | Delivers better service and builds loyalty. |
Sustained Gains | Maintains progress through regular audits and training. |
Teams that use process mapping tools and involve employees at every stage create a strong foundation for ongoing improvement. Adopting these practices prepares organizations to adapt to new technologies and future challenges.
FAQ
What is the main goal of Six Sigma process mapping?
The main goal is to help teams see every step in a process. This makes it easier to find problems, reduce waste, and improve quality. Teams use maps to make better decisions and reach business goals.
How does process mapping support team collaboration?
Process mapping gives everyone a clear picture of the workflow. Teams can spot issues together and share ideas for improvement. This shared view builds trust and helps people work toward common goals.
Which tools work best for creating process maps?
Teams often use digital tools like Microsoft Visio, Creately, or Canva. These platforms offer templates, symbols, and real-time editing. Teams can choose the tool that fits their needs and supports easy sharing.
Can process mapping help reduce errors?
Yes, process mapping helps teams find where mistakes happen. By showing each step, teams can fix weak points and set up checks. This leads to fewer errors and better results.
How often should teams update process maps?
Teams should review and update process maps whenever a process changes. Regular updates keep maps accurate and useful. Many teams check their maps during audits or after improvement projects.
What is the difference between a flowchart and a value stream map?
A flowchart shows the steps and decisions in a process. A value stream map highlights how value moves through the process and points out waste. Both tools help teams improve, but they focus on different details.
Who should be involved in process mapping?
Teams should include people who know the process well, such as subject matter experts and frontline workers. Involving different roles ensures the map is accurate and covers all important steps.
Is process mapping only for manufacturing?
No, process mapping works in many fields. Teams in healthcare, finance, education, and service industries use it to improve workflows, reduce waste, and boost quality.
Tip: Process mapping benefits any team that wants to understand and improve how work gets done.


