How to Simplify Workflows with Lean Six Sigma Process Mapping

Lean Six Sigma Process Mapping helps teams see every step in a process. This visual approach makes complex tasks easier to understand and manage. Systems and teams use value stream mapping to spot bottlenecks and remove non-value-added activities. Customers benefit from faster service and fewer errors. The goal centers on reducing waste and improving efficiency. The table below shows how organizations achieve better results with targeted optimization steps.
Evidence Description | Impact on Waste Reduction and Efficiency |
|---|---|
Lean Six Sigma enables organizations to identify and eliminate non-value-added activities. | Reduces waste by focusing on value-added processes. |
Statistical analysis helps practitioners make data-driven decisions. | Drives process improvement through informed choices. |
Process measurement and analysis identify major sources of waste. | Leads to targeted waste reduction efforts. |
Lean Six Sigma methodologies enhance overall performance. | Optimizes resource utilization and reduces defects. |
Key Takeaways
Lean Six Sigma Process Mapping helps teams visualize every step in a workflow, making complex tasks easier to understand.
Using flowcharts allows teams to identify bottlenecks and remove unnecessary actions, leading to faster service and fewer errors.
Mapping processes helps organizations reduce waste by focusing on value-added activities, improving overall efficiency.
Involve employees in the mapping process to gather insights and ensure accuracy, which leads to better results.
Regularly review and update process maps to reflect changes in workflows and maintain their effectiveness.
Utilize different types of process maps, like SIPOC and Swimlane diagrams, to analyze workflows from various perspectives.
Implementing Lean Six Sigma tools can lead to measurable improvements, such as reduced cycle times and fewer customer complaints.
Start with one process to build confidence and gradually expand mapping efforts for greater organizational impact.
Lean Six Sigma Process Mapping Overview
Visualizing Workflows
Lean Six Sigma Process Mapping acts as a visual tool that shows each step, activity, and flow within a process. Teams and systems use flowcharts to outline the sequence of tasks, making complex workflows easier to understand. This approach provides a clear roadmap for everyone involved. When teams see the process laid out visually, they can spot where delays or errors might occur. The visual representation helps all members share a common understanding, which improves communication and collaboration.
Process mapping gives teams a clear picture of the workflow. This clarity helps identify areas of waste and inefficiency. It also supports collaboration by making sure everyone understands the process.
The most common flowchart types used in Lean Six Sigma Process Mapping include:
Flowchart Type | Description |
|---|---|
Deployment Flowchart | Represents roles of different departments/stakeholders, emphasizing efficiency and waste reduction. |
Alternate Path Flowchart | Visualizes alternative routes or scenarios, helping to identify redundancies and potential bottlenecks. |
Process Flowchart | Depicts sequential steps of a process using standardized symbols, aiding in identifying inefficiencies. |
Once a process map is created, teams can use it to analyze the workflow for inefficiencies. It also serves as a training tool for new employees, helping them understand their roles and the overall process.
Reducing Waste
Lean Six Sigma Process Mapping helps systems and teams find and reduce waste in their workflows. By mapping out each step, teams can see where resources are wasted or where unnecessary actions occur. The process map makes it easier to pinpoint areas that need improvement.
The most common types of waste identified through process mapping include:
Transport: Waste from unnecessary movement of materials or information.
Inventory: Excess stock that ties up resources and space.
Motion: Unnecessary movements by employees during tasks.
Waiting: Idle time due to delays in materials or information.
Overproduction: Producing more than needed, leading to excess inventory.
Over-processing: Adding unnecessary features that do not add value.
Defects: Products that fail to meet quality standards requiring rework.
Skills: Underutilization or overtraining of personnel.
A study in the food manufacturing industry showed that Lean Six Sigma tools, especially the DMAIC approach, help companies assess their processes and find areas for improvement. By applying these tools, organizations reduce waste and improve operational efficiency.
Improving Efficiency
Lean Six Sigma Process Mapping allows organizations to enhance efficiency by identifying bottlenecks and streamlining workflows. The visual map outlines each step, input, and output, making it easier to spot delays or errors. When teams see the entire process, they can focus on areas that slow down production or cause mistakes.
Process mapping helps organizations gain a comprehensive understanding of their workflows. This makes it simpler to find bottlenecks and inefficiencies, leading to better operational efficiency.
Systems and teams often use techniques like DMAIC, SIPOC, and Value Stream Mapping to improve equipment efficiency and reduce production fluctuations. These methods support productivity gains and more consistent results. By standardizing procedures and solving problems identified in the process map, teams achieve faster service and fewer errors for their clients.
Process Mapping Fundamentals
Inputs, Actions, Outputs
Process maps help systems and teams see how each part of a workflow connects. Every process includes three main elements: inputs, actions, and outputs. Inputs start the process, actions describe what happens, and outputs show the results. These elements work together to form a clear picture of the workflow.
Description | |
|---|---|
Activities | Tasks or operations that are part of the process, such as ‘Approve Request’. |
Inputs | Triggers for activities, like a customer order. |
Outputs | Results produced by activities, such as the shipped product. |
A Lean Six Sigma process map often includes several components:
Phases that show the start, middle, and end of the process.
Procedural measures that connect inputs and outputs to each phase.
Symbols like rectangles, ovals, diamonds, and arrows to represent actions, decisions, and flow.
Verification steps to ensure the map matches the real process, with reviews from stakeholders.
Process maps help systems and teams understand how each step leads to the next, making it easier to spot problems or delays.
End-to-End Mapping
End-to-end mapping gives a complete view of a business process from start to finish. This approach helps systems and teams find gaps, risks, and areas for improvement. By showing every step, end-to-end mapping ensures that all necessary inputs and expected outputs are included.
Provides a visual representation of business process steps.
Highlights opportunities for improvement.
Ensures all necessary inputs and expected outputs are accounted for.
When systems and teams use end-to-end mapping, they can see where the process breaks down or where waste occurs. This makes it easier to improve the workflow and deliver better results to clients.
Types of Process Maps
Different types of process maps serve different needs. Each type helps systems and teams analyze workflows in unique ways.
Process Map Type | Purpose | Description |
|---|---|---|
SIPOC | High-level overview | Defines the scope and identifies key elements before diving into details. Useful in early stages. |
Swimlane | Clarifies responsibilities | Assigns each step to specific roles or departments, helping to identify bottlenecks. |
Value Stream | Focuses on value | Scrutinizes processes to determine what adds value and what constitutes waste. |
SIPOC: Offers a high-level overview, helping everyone understand the process scope.
Swimlane Diagrams: Show who does what, making it easier to find inefficiencies.
Value Stream Mapping: Focuses on value and waste, giving a detailed look at the workflow.
Other maps include high-level and detailed process maps. High-level maps give a broad view, while detailed maps break down each step. These tools help systems and teams choose the right approach for their workflow analysis.
DMAIC Framework Application

Define Phase
In the Define phase, systems and teams use Lean Six Sigma Process Mapping to visualize current workflows. This step creates a clear picture of how work moves from start to finish. By mapping out each activity, teams can spot bottlenecks and inefficiencies. The process map provides a tangible view of the current state, making it easier to set improvement goals. Teams often use BPMN diagrams during this phase. These diagrams help everyone understand the process and agree on what needs to change.
Process mapping in the Define phase highlights areas that slow down work or cause confusion. This clarity helps teams focus their improvement efforts.
Common workflow issues addressed in this phase include:
Visualizing the workflow to find bottlenecks.
Identifying steps that do not add value.
Recognizing areas with potential for improvement.
A clear process map at this stage sets the foundation for all later phases in the DMAIC framework.
Measure Phase
During the Measure phase, systems and teams collect data to understand how the process performs. Process mapping plays a key role by showing each step and its sequence. This visual guide helps teams pinpoint where to gather data and what to measure. Process mining techniques often support this phase, allowing teams to analyze existing workflows and spot inefficiencies.
Process mapping serves as a visual representation of the steps in a process, which is essential during the Measure phase of DMAIC. It helps in pinpointing inefficiencies and variations, as well as identifying critical data collection points. This visual clarity is vital for collecting accurate and relevant data, which is necessary for assessing current performance and directing improvement initiatives.
Teams use the process map to:
Identify where delays or errors occur.
Determine which steps require measurement.
Ensure data collection covers all important activities.
By mapping the process, teams make sure they gather the right data to support improvement.
Analyze Phase
In the Analyze phase, teams use process maps to study the workflow and find root causes of problems. The process map shows all steps, actions, inputs, and outputs. This detailed view helps teams see how changes in one part affect the rest. Process design techniques refine the workflow based on data insights.
Technique | Description |
|---|---|
Process Map Maturation | A graphical representation of activities, decisions, and elements in a procedure, detailing the 'as-is' state. |
Process Map Analysis | Illustrates the relationship between inputs (X) and outputs (Y), identifying critical to quality (CTQs) factors. |
Process Map Visualization | Flowchart showing the current state of the process, helping to visualize potential causes of issues. |
Teams use these techniques to:
Show the relationship between inputs and outputs.
Support root cause analysis.
In the Analyze phase, process maps serve as flowcharts that depict the current state of processes, illustrating all steps, actions, inputs, and outputs. This visualization enables teams to identify potential causes of inefficiencies by examining changes within the process. Systems and teams can then focus on the most important issues, making it easier to plan effective solutions.
Process Mapping Technique | Description | |
|---|---|---|
Define | BPMN Diagrams | Visualize current processes to set clear improvement objectives. |
Measure | Process Mining | Analyze existing processes to identify inefficiencies. |
Analyze | Process Design | Refine process redesigns based on insights from data. |
Improve Phase
In the Improve phase, systems and teams use Lean Six Sigma Process Mapping to turn insights into action. The process map serves as a visual guide, showing every step and interaction in the current workflow. This clarity helps stakeholders understand how the process works and where changes can make the biggest impact.
Teams often start by reviewing the existing process map. They look for steps that cause delays, errors, or waste. Once they identify these areas, they brainstorm solutions and discuss possible improvements. The process map provides a framework for these discussions, making it easier to reach decisions.
Process mapping visually represents the steps and interactions of a process, aiding stakeholders in understanding current operations.
It identifies areas needing improvement, providing a framework for discussions and decision-making.
Developing 'To-Be Maps' based on potential solutions guides the team towards the new process and serves as a training reference.
After selecting the best solutions, teams create a "To-Be Map." This new map shows how the improved process should work. It acts as a blueprint for change and helps everyone see what the future workflow will look like. The "To-Be Map" also serves as a training tool for employees, making the transition smoother.
Process mapping in the Improve phase helps teams visualize the current state and identify improvement opportunities. This visual representation supports discussions about potential changes and ensures that solutions are implemented effectively, leading to better efficiency and quality.
Systems and teams use these maps to guide the implementation of new steps. They monitor the process closely, checking if the changes deliver the expected results. If problems arise, teams can quickly update the map and adjust their approach. This cycle of mapping, improving, and reviewing helps organizations achieve lasting improvements.
Control Phase
The Control phase ensures that improvements last. Systems and teams create a roadmap to implement solutions and maintain success over time. This phase focuses on keeping the new process running smoothly and preventing old problems from returning.
The Control phase involves creating a roadmap to implement solutions effectively and ensure ongoing success.
It includes strategies to maintain improvements and helps stakeholders transition smoothly to the new processes.
The control phase is essential for sustainable change and involves tracking process performance.
A process control plan is based on the new ideal process map, clarifying responsibilities for each aspect of the process.
Teams develop a process control plan using the updated process map. This plan outlines who is responsible for each part of the workflow. It also sets up ways to track performance, such as regular checks or data collection. By following the control plan, systems and teams can spot issues early and take action before they become bigger problems.
The process map remains a key tool in this phase. It helps everyone stay aligned and understand their roles. When new employees join, the map serves as a training resource. If the process changes again, teams update the map to reflect the latest steps.
Sustaining improvements requires clear communication and regular monitoring. The process map and control plan work together to keep the workflow efficient and effective.
By using Lean Six Sigma Process Mapping throughout the Control phase, organizations ensure that gains in efficiency and quality continue long after the initial changes.
Process Mapping Steps

Define Scope
Defining the scope sets the foundation for any successful process map. Systems and teams begin by identifying the process that needs documentation. They gather information from participants through interviews or direct observation. This step helps clarify the start and end points, the stakeholders, and all parties involved. Decision points within the process also become clear at this stage.
A structured approach to defining scope often includes:
Identify the relevant process or processes.
Work backward from the final objective to understand the desired outcome.
Decide on the scope by setting clear start and end points.
Begin with a high-level SIPOC (Suppliers, Inputs, Process, Outputs, Customers) diagram.
Refine the SIPOC using a Key Process Output Variable (KPOV) chart.
Map out detailed steps for selected parts of the process.
Include relevant metrics to measure performance.
Tip: A well-defined scope prevents unnecessary details and keeps the process map focused on the most important activities.
By following these steps, systems and teams ensure that the process map will address the right problems and support workflow simplification.
Map Current Steps
Mapping the current steps gives a clear picture of how work flows in real time. Systems and teams document each activity, decision point, and handoff. They often use flowcharts or diagrams to visualize the sequence of tasks. This step helps everyone see how the process actually works, not just how it should work.
To ensure accuracy, teams should:
Involve employees who perform the process daily. Their insights reveal hidden steps or common workarounds.
Review the process map with different teams. Feedback from multiple perspectives helps validate the map.
Analyze the map for pain points. Identifying areas of inefficiency or frequent issues guides future improvements.
Practice | Description |
|---|---|
Involve Employees | Engage those who perform the process to provide insights and ensure accuracy. |
Review with Teams | Share the process map with different teams for validation and feedback. |
Analyze for Pain Points | Examine the map to identify areas of inefficiency or issues. |
Systems and teams that map current steps accurately can spot bottlenecks, delays, and unnecessary actions. This clarity supports better decision-making and sets the stage for improvement.
Review for Accuracy
Reviewing the process map for accuracy ensures that it reflects the real workflow and meets the intended goals. Systems and teams follow several best practices to maintain accuracy and completeness:
Define the scope and purpose of the process map to clarify goals and avoid unnecessary details.
Use a standard notation and format, such as BPMN or SIPOC, for clarity and consistency.
Involve the right people, including those who perform and manage the process, to keep the map accurate over time.
Validate and verify the process map through walkthroughs and audits. These methods confirm that the map matches actual execution.
Document and communicate the process map effectively. Clear communication ensures that all stakeholders understand the workflow.
Note: Regular reviews and updates help systems and teams keep the process map relevant as workflows change.
Lean Six Sigma Process Mapping relies on these steps to create reliable, actionable maps. Accurate process maps help systems and teams simplify workflows, reduce waste, and improve efficiency.
Analyze for Issues
Systems and teams use Lean Six Sigma process mapping to examine workflows and uncover hidden problems. They study each step to find areas that slow down progress or create confusion. This analysis helps teams understand why certain issues happen and where improvements can make the biggest impact.
Teams often look for the following common issues during analysis:
Process gaps that interrupt the flow of work
Redundant work that wastes time and resources
Implicit or unclear requirements that cause mistakes
Tricky handoffs between departments or individuals
Conflicting objectives that lead to confusion
Other common problem areas that affect quality or speed
Careful analysis of process maps allows teams to see the root causes of inefficiency. This step is essential for building a strong foundation for future improvements.
Teams gather feedback from employees who work with the process every day. They compare the process map to actual workflow, checking for steps that do not add value. By identifying these issues, systems and teams prepare to redesign the process for better results. This approach ensures that clients benefit from smoother workflows and fewer errors.
Workflow Examples
Invoice Processing
Systems and teams often face challenges with invoice processing. Delays, errors, and missing information can slow down payments and frustrate clients. Lean Six Sigma Process Mapping helps teams visualize each step, from receiving an invoice to final approval. They use flowcharts to show how invoices move through departments. This approach highlights bottlenecks, such as waiting for signatures or missing data.
Teams review the process map and spot steps that do not add value. They remove duplicate checks and automate data entry. As a result, invoices move faster and with fewer mistakes. Clients receive payments on time, and employees spend less time fixing errors. The workflow becomes simpler, and resources are used more efficiently.
Teams that use process mapping for invoice processing see fewer delays and improved accuracy. This leads to better relationships with clients and suppliers.
Customer Onboarding
Customer onboarding can involve many steps, such as setting up accounts, granting access, and sending welcome emails. Systems and teams use Lean Six Sigma Process Mapping to make this process smoother. They start by mapping the current workflow, identifying where new hires or clients face delays.
A documented case study shows how teams improved onboarding by using the DMAIC method. They set a goal to give new hires immediate access to necessary items 95% of the time. During the Define phase, teams found issues with parking access, information accuracy, and email communication. Quick fixes included a "Day One E-mail" and standardized start dates. These changes streamlined onboarding and removed bottlenecks.
Improvement Area | Description |
|---|---|
Project Goal | Increase new hires' immediate access to necessary items to 95% to enhance satisfaction. |
Methodology | Utilized DMAIC to identify and eliminate inefficiencies in the onboarding process. |
Quick Fixes During Define Phase | Implemented a 'Day One E-mail' and standardized start dates to streamline onboarding. |
Current Process Issues | Identified bottlenecks in parking access, new hire information accuracy, and email communication. |
Results | Achieved a 1.05 sigma shift, exceeding the goal of 95% immediate access for new hires. |
Teams achieved a significant improvement, with a 1.05 sigma shift and more than 95% of new hires receiving immediate access. Clients benefit from a smoother start, and employees feel more satisfied.
Manufacturing Waste Reduction
Manufacturing often involves complex workflows with many steps. Waste can occur through excess movement, waiting, or overproduction. Systems and teams use Lean Six Sigma Process Mapping to analyze each part of the production line. They create value stream maps to show where materials and information flow.
Teams identify steps that cause delays or use extra resources. They redesign the workflow to reduce unnecessary movement and waiting. For example, they may rearrange equipment or change the order of tasks. These changes help reduce waste and improve efficiency.
When teams apply process mapping in manufacturing, they see less waste and more consistent results. Clients receive higher quality products, and systems use resources more effectively.
Benefits and Next Steps
Simpler Workflows
Systems and teams often struggle with complicated processes that slow down work and cause mistakes. Lean Six Sigma Process Mapping helps break down these complex workflows into clear, manageable steps. By using visual tools, teams can see each part of a process and remove unnecessary actions. This leads to faster results and fewer errors for clients.
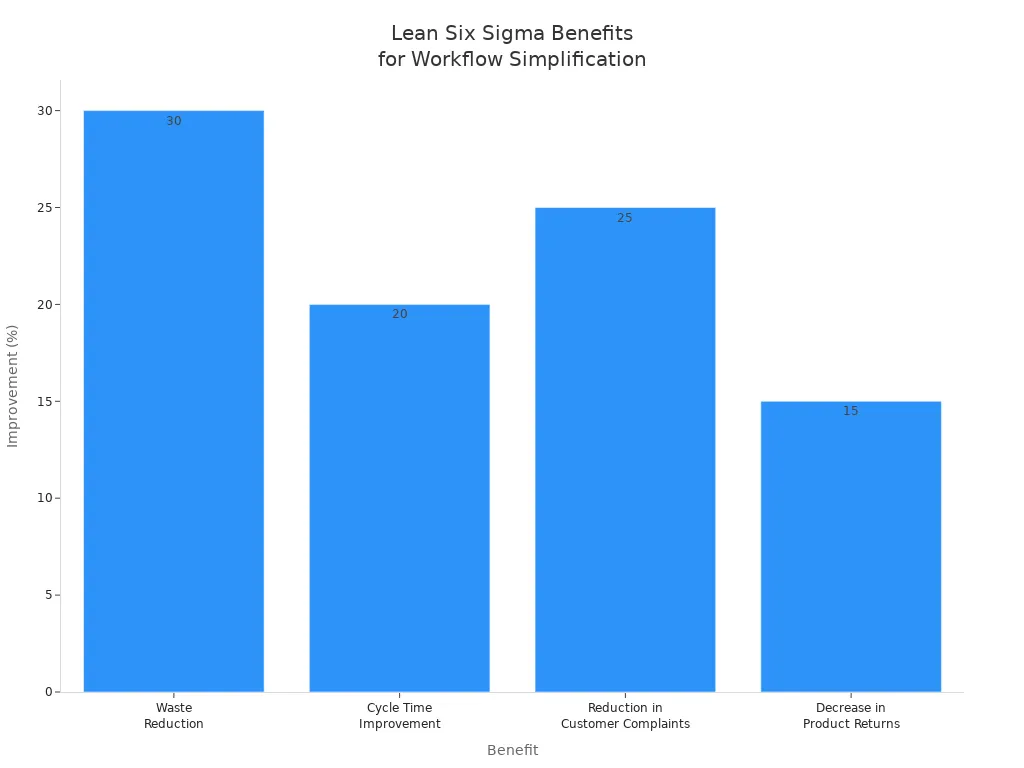
The benefits of workflow simplification are measurable. Many organizations report significant improvements after applying process mapping:
Benefit | Metric |
|---|---|
Waste Reduction | |
Cycle Time Improvement | 20% |
Reduction in Customer Complaints | 25% |
Decrease in Product Returns | 15% |
Clients at systems and teams experience smoother workflows, which means less time spent fixing problems and more time focusing on what matters most.
Better Communication
Clear communication is essential for any successful team. Lean Six Sigma Process Mapping gives everyone a shared view of how work gets done. When teams use visual maps, they can discuss each step and spot problems together. This approach helps break down barriers between departments and encourages teamwork.
Lean Six Sigma principles streamline workflows, enhancing team communication.
Team involvement in the improvement process fosters collaboration.
Visual tools improve understanding among team members.
Effective communication across teams breaks down silos.
Collaboration encourages a culture of continuous improvement.
Process mapping visually documents workflows, making inefficiencies easier to spot.
It clarifies how work flows from one stage to the next, aiding in team discussions.
Systems and teams find that better communication leads to faster problem-solving and stronger results for clients.
Sustainable Improvement
Sustainable improvement means making changes that last. Lean Six Sigma Process Mapping supports this by helping organizations plan carefully and involve everyone in the process. Management support and employee engagement play a big role in keeping improvements on track.
Careful planning and management support enhance organizational processes.
Continuous improvement and waste reduction align with long-term goals.
Employee engagement helps sustain improvements over time.
Tools like value stream mapping and process mapping identify inefficiencies and areas for optimization.
Clients at systems and teams benefit from these lasting changes. They see ongoing progress, not just quick fixes. This approach builds a strong foundation for future growth.
Tip: Want to learn more about how your team can achieve these benefits? Reach out to us for guidance on starting your own process mapping journey.
Getting Started
Lean Six Sigma process mapping offers a practical way for systems and teams to simplify workflows. Many organizations see strong results when they take the first step. Clients at systems and teams often notice faster processes and fewer mistakes after mapping their workflows.
To begin, teams should follow a clear set of steps. These steps help guide the mapping process and make it easier to see improvements.
Step-by-Step Guide to Start Process Mapping:
Choose a Process: Select a workflow that needs improvement. Teams often start with areas that cause delays or frequent errors.
Gather Information: Collect details from employees who work with the process every day. Their insights reveal hidden steps and common challenges.
Define the Scope: Set clear boundaries for the process. Decide where the process starts and ends.
Create a Visual Map: Use flowcharts or diagrams to show each step. Visual tools help everyone understand the workflow.
Review with Stakeholders: Share the map with team members and managers. Feedback ensures the map matches reality.
Analyze for Issues: Look for bottlenecks, redundant steps, or unclear handoffs. Mark areas that need improvement.
Redesign the Workflow: Remove unnecessary actions and add solutions for common problems. Update the map to show the new process.
Monitor Results: Track changes and measure improvements. Use data to confirm that the new workflow works better.
Tip: Teams that involve employees in every step often see better results. Their feedback helps create accurate maps and lasting improvements.
Common Tools for Process Mapping
Tool Name | Purpose | Example Use Case |
|---|---|---|
SIPOC Diagram | High-level overview | Mapping supplier-to-customer flow |
Flowchart | Step-by-step visualization | Documenting invoice processing |
Swimlane Map | Assigning responsibilities | Clarifying department handoffs |
Value Stream | Identifying waste and value | Improving manufacturing steps |
Systems and teams can choose the tool that fits their needs. Each tool helps visualize workflows and spot areas for change.
Getting Support
Many organizations find success by starting small. Teams often pick one process and build confidence before tackling larger projects. Management support helps keep the effort on track. Training sessions and workshops give employees the skills they need.
Note: Clients at systems and teams benefit most when everyone understands the process and works together. Clear communication and teamwork lead to lasting results.
Starting Lean Six Sigma process mapping does not require advanced skills. Teams need a willingness to learn and a commitment to improvement. By following these steps, organizations can simplify workflows, reduce waste, and deliver better results for clients.
Lean Six Sigma Process Mapping helps systems and teams simplify workflows and reduce waste. Visual tools allow clients at systems and teams to see each step and improve efficiency. Teams gain clearer communication and achieve sustainable results. Readers can start mapping their own processes to unlock these benefits. For those interested in learning more, contact us to discover how workflow simplification can help your organization.
FAQ
What is Lean Six Sigma process mapping?
Lean Six Sigma process mapping shows each step in a workflow. Teams use it to find waste and improve efficiency. Clients at systems and teams benefit from clear, visual guides that make processes easier to understand and manage.
How does process mapping help reduce waste?
Process mapping helps systems and teams see where resources get wasted. By showing every step, teams can remove actions that do not add value. Clients notice faster service and fewer mistakes after mapping workflows.
Which process mapping tools work best for beginners?
Beginners often start with SIPOC diagrams or simple flowcharts. These tools help systems and teams outline steps and spot problems quickly. Clients at systems and teams see results without needing advanced skills.
Can process mapping improve communication between teams?
Yes. Process mapping gives everyone a shared view of the workflow. Teams discuss each step together, which helps break down barriers. Clients at systems and teams experience better teamwork and fewer misunderstandings.
How often should teams update their process maps?
Teams should review process maps whenever workflows change or problems appear. Regular updates keep maps accurate. Clients at systems and teams benefit from maps that reflect real work, not outdated steps.
What are common mistakes in process mapping?
Some teams skip steps or forget to involve key people. Others use unclear symbols or ignore feedback. Systems and teams avoid these mistakes by including everyone and using standard symbols. Clients get better results with clear, complete maps.
How do systems and teams measure success after mapping workflows?
Teams track metrics like cycle time, error rates, and customer complaints. They compare results before and after changes. Clients at systems and teams see improvements in speed, quality, and satisfaction.
Is Lean Six Sigma process mapping only for large organizations?
No. Systems and teams of any size can use process mapping. Small teams often see quick wins. Clients at systems and teams benefit from simpler workflows, no matter the organization’s size.


