How to master business process mapping step by step
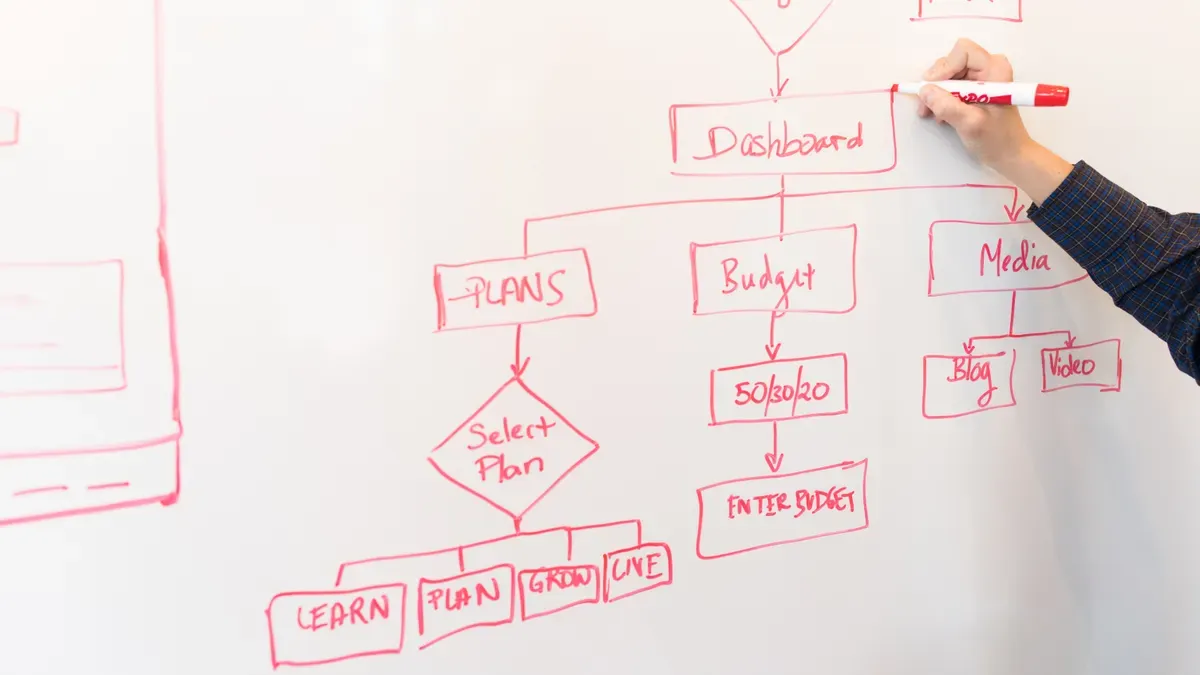
Business Process Mapping helps organizations visualize how tasks flow from start to finish. Many companies see clear benefits when they reach a certain level of mapping maturity. For example, research shows that at Level 2 maturity, a positive link exists between mapping and performance, while higher levels do not always show further gains.
BPM Maturity Level | Impact on Performance |
|---|---|
Level 2 | Positive relation at 0.05 level |
Level 3 | No conclusive evidence due to collinearity |
Level 4 | No conclusive evidence due to collinearity |
Level 5 | No further positive impact observed |
Clients and customers expect smooth processes. Teams must focus on optimization steps that deliver real value.
Key Takeaways
Business Process Mapping helps visualize workflows, making it easier to identify inefficiencies and improve processes.
Achieving Level 2 maturity in mapping can lead to better performance, while higher levels may not show additional benefits.
Clear process maps enhance communication and collaboration among teams, ensuring everyone understands their roles.
Using the right type of process map, like flowcharts or swimlane diagrams, is crucial for effective analysis and improvement.
Regularly updating process maps keeps them relevant and aligned with current business needs, driving continuous improvement.
Involving team members in the mapping process ensures accuracy and reflects real work, leading to better outcomes.
Training teams on process mapping basics and ongoing practices enhances efficiency and helps identify areas for improvement.
Utilizing digital tools for process mapping allows for easy sharing, collaboration, and real-time updates, improving overall effectiveness.
Business Process Mapping Overview

Definition
Business Process Mapping uses symbols, diagrams, and charts to turn complex business activities into clear visuals. These visuals show the steps, sequence, stakeholders, and scope of each process. A business process means a set of activities that help an organization reach a specific goal. Business process management takes a structured approach to improve how organizations complete work, serve customers, and create value.
Diagrams make it easier to see how work flows.
Symbols help teams spot important steps and decisions.
Charts show who is responsible for each part of the process.
Purpose
The main purpose of Business Process Mapping is to help organizations work better and smarter. It gives a clear picture of how things get done. This helps teams find ways to improve and align their work with company goals.
Objective | Description |
|---|---|
Organizational Effectiveness | Helps organizations become more effective by making processes clear. |
Alignment with Company Objectives | Makes sure processes match company values and strengths. |
Support for Business Goals | Supports process improvement, training, and following rules and standards. |
Note: Clear process maps help teams understand their roles and how their work fits into the bigger picture.
Benefits
Organizations report many benefits after using Business Process Mapping. These benefits help both the company and its employees.
Benefit | Description |
|---|---|
Shows each activity’s role, making it easier to adjust and streamline tasks. | |
Enhanced Resource Utilization | Helps use resources wisely, reducing waste and boosting output. |
Better Communication and Collaboration | Makes workflows and responsibilities clear, improving teamwork. |
Continuous Process Improvement | Highlights areas for change, allowing for ongoing updates and efficiency. |
Streamlined Training and Onboarding | Makes it easier for new hires to learn workflows, cutting down training time. |
Improved Business Performance | Aligns work with company goals, increasing profits and customer satisfaction. |
Regulatory Compliance | Documents workflows for easier checks during audits. |
Agile Decision-Making | Supports quick, informed choices, helping teams respond to changes. |
Increased Accountability and Transparency | Defines roles clearly, encouraging ownership and teamwork. |
Business Process Mapping gives organizations the tools to see, understand, and improve their processes. This leads to better results and a stronger team.
Why Process Mapping Matters
Efficiency Gains
Organizations often seek ways to work faster and reduce waste. Process mapping helps teams see every step in a workflow. When they visualize tasks, they can spot delays and remove unnecessary actions. Many companies have seen strong results:
A healthcare company streamlined its new product development process, which led to higher efficiency and profits.
A manufacturing company improved its procure-to-pay process, cutting costs and boosting operational performance.
In a mid-sized interior-design company, mapping the process from design approval to delivery reduced material waste from 15% to 7%. Client satisfaction scores also rose by 12%.
An intergovernmental organization made over two dozen process improvements, saving more than $5 million each year.
These examples show that process mapping can drive real gains in speed, quality, and cost savings.
Process Improvement
Teams use process maps to make their work better. A clear diagram shows each step, who does it, and when it happens. This structure helps teams find weak spots and design better ways to work. The table below highlights how process mapping supports improvement:
Evidence Description | Key Insight |
|---|---|
Process maps provide structured flow diagrams that enhance clarity. | This clarity helps in identifying process flaws and designing improvements. |
The structure of process maps aids in understanding roles and sequences of activities. | It allows teams to visualize workflows and uncover areas for improvement. |
Team discussions during process mapping reveal both known and unknown process flaws. | These discussions are crucial for uncovering improvement opportunities. |
Participants often experience 'Aha moments' during mapping. | Such realizations correspond to potential areas for process enhancement. |
When teams talk through each step, they often discover problems they did not see before. These moments lead to better processes and stronger results.
Communication
Clear communication keeps teams working together. Business Process Mapping gives everyone a shared picture of how work gets done. This visual language makes complex tasks easier to understand. It also helps teams from different departments work together. Some key benefits include:
Provides a universal visual language for workflows.
Makes complex procedures easier for all team members to understand.
Facilitates cross-functional workshops, improving understanding and alignment between departments.
Breaks down silos and fosters better collaboration.
Ensures everyone works from the same playbook.
When everyone sees the same map, they can align their efforts and avoid confusion. This leads to better teamwork and smoother operations.
Types of Process Maps
Flowcharts
Flowcharts represent one of the most common tools in process mapping. They use simple shapes and arrows to show the sequence of steps in a process. Flowcharts help teams visualize how information moves and where decisions occur. This type of map works well for showing broad steps rather than every detail. Many people use flowcharts in software development and project management because they make it easy to follow the flow of tasks.
The table below highlights how flowcharts differ from other process maps:
Feature | Flowcharts | Process Maps |
|---|---|---|
Level of Detail | Simplifies processes into broad individual steps | Breaks down complex processes in detail |
Use Cases | Useful in software development and project management | Appropriate for manufacturing and quality management |
Focus | Emphasizes flow of information and decision-making | Highlights inputs, actions, and outputs |
Flowcharts provide a quick overview, making them ideal for explaining processes to new team members or for troubleshooting.
Swimlane Diagrams
Swimlane diagrams add another layer to process mapping by organizing steps into lanes. Each lane represents a person, team, or department. This format shows not only what happens but also who is responsible for each step. Swimlane diagrams help teams spot handoffs and gaps in communication.
Industries that often use swimlane diagrams include:
Project management: Illustrates collaboration among departments like marketing, sales, and operations.
Customer service: Visualizes interactions between support, technical teams, and billing for efficient issue resolution.
Product development: Details the roles of design, engineering, and quality assurance in product launch.
Compliance processes: Clarifies tasks for each role involved in regulatory workflows such as approvals or audits.
Swimlane diagrams make complex processes easier to understand by showing how different groups work together.
Value Stream Maps
Value stream mapping plays a key role in lean management. Teams use this tool to diagram every step in the flow of materials and information needed to deliver a product from order to delivery. The current state map captures the actual condition of the value stream, while the future state map shows the ideal flow after improvements. These maps help teams see the entire process, find waste, and improve efficiency.
Key components of value stream maps include:
Current State Map: Captures the actual flow of materials and information.
Future State Map: Represents the ideal flow after improvements.
Process Boxes: Indicate steps in the process.
Process Data Boxes: Provide data related to each process step.
Timeline & Summary Statistics: Offer insights into the overall efficiency and time taken in the process.
Value stream maps give organizations a powerful way to analyze and improve their processes. By using these maps, teams can support Business Process Mapping efforts and drive continuous improvement.
SIPOC
SIPOC stands for Suppliers, Inputs, Process, Outputs, and Customers. This method gives teams a high-level view of a process. It helps them see the main parts and the people involved. SIPOC diagrams work well at the start of a project or when a team needs to understand a process quickly.
A SIPOC diagram uses a simple table or chart. Each column represents one part of the process. Teams fill in each column to show who supplies the inputs, what those inputs are, the steps in the process, the outputs, and the customers who receive those outputs. This structure makes it easy to see the big picture.
Note: SIPOC diagrams do not show every detail. They focus on the main steps and key players. This makes them different from detailed flowcharts or value stream maps.
The SIPOC method provides a structured overview of a process. Teams use it to identify important components and stakeholders. Unlike other process mapping techniques, SIPOC offers a simplified view. This helps teams communicate the essence of a process. It also builds a shared understanding among team members.
Here is an example of a SIPOC table for a simple order fulfillment process:
Suppliers | Inputs | Process Steps | Outputs | Customers |
|---|---|---|---|---|
Vendor | Order form | Receive order | Shipped order | Customer |
Warehouse | Inventory list | Pick items | Invoice | Accounting |
Shipping team | Packing slips | Pack and ship | Tracking number | Customer |
Teams often use SIPOC diagrams in the early stages of Business Process Mapping. These diagrams help teams agree on the scope of a process before they dive into details. SIPOC also works well in cross-functional workshops. It brings together people from different departments to build a common understanding.
Some key benefits of SIPOC diagrams include:
Quick identification of process boundaries
Clear definition of roles and responsibilities
Easy communication with stakeholders
Support for process improvement projects
SIPOC diagrams help teams avoid confusion. They make it easier to spot missing steps or unclear responsibilities. By using SIPOC, organizations can set a strong foundation for more detailed process analysis later.
Process Mapping Symbols
Business process maps use a set of standard symbols. These symbols help teams read and understand the flow of work. Each symbol has a clear meaning. Using the right symbols makes process maps easy to follow.
Common Symbols
Process mapping uses several shapes and icons. Each one stands for a different part of the process.
Start/End
Oval or Circle: This shape marks where a process begins or ends. Teams use it to show the entry and exit points of a workflow.
Rounded Rectangle: Sometimes, a rounded rectangle shows a group of related tasks or a subprocess that starts or finishes a process.
Tip: Always use the same symbol for start and end points to avoid confusion.
Steps
Rectangle: This symbol stands for a specific task or action. Each rectangle shows what happens at that step in the process.
Document: A rectangle with a wavy base represents a document or report. It shows when a process creates or uses paperwork.
Subroutine: A rectangle with double lines on each side means a complex sub-process. Teams can map this part in more detail elsewhere.
Decisions
Diamond: This shape shows a decision point. It asks a question with two or more possible answers. The process follows a different path based on the answer.
Parallelogram: This symbol can show input or output, such as data or materials entering or leaving the process.
Arrows
Arrow: Arrows connect the symbols. They show the direction of the workflow. Teams follow the arrows to see what happens next.
Circle (Connector): A small circle links different parts of a map. It helps when a process jumps to another section or continues on a new page.
Note: External activity symbols show tasks done outside the main process. These tasks might involve suppliers or customers.
Symbol Usage Tips
Teams can make process maps clear and useful by following a few best practices:
Use a common set of symbols for every map. This helps everyone understand the diagrams.
Start with simple shapes. Match the level of detail to the audience’s needs.
Add short labels to each symbol. Legends or cheat sheets help new team members learn the symbols.
Use swimlanes to show who does each task. This makes roles and responsibilities clear.
Keep diagrams neat and organized. Avoid crossing arrows or cluttered layouts.
Keeping symbols simple and consistent helps teams read and use process maps with confidence.
Process Mapping Steps

Define Scope
Teams begin Business Process Mapping by defining the scope of the project. Scope sets clear boundaries for the process. It helps everyone understand where the process starts and ends. This prevents scope creep and keeps the mapping focused.
Criteria | Description |
|---|---|
Clarify where the process starts and ends to avoid scope creep. |
Teams must ensure the process’s product or service aligns with business goals. They need in-depth knowledge of business strategy. Understanding business rules helps teams make informed decisions.
The process’s product or service must align with business goals.
In-depth knowledge of business strategy is necessary for effective mapping.
Understanding business rules aids in making informed decisions.
Teams identify measurement opportunities to improve performance. Mapping reveals critical points in the workflow that may require attention.
Identify measurement opportunities to improve performance.
Mapping reveals critical points in the workflow that may require attention.
Tip: Teams should write a clear scope statement before starting. This statement describes the process boundaries, goals, and expected outcomes.
Gather Information
Teams collect information to understand how the process works. They use several methods to gather accurate data.
Facilitated discovery workshops
Analysis of existing documentation
Direct work observation
Business analysis design
Import of existing process maps
Teams start with the current situation. They involve key personnel who know the process well. Breaking the process into manageable steps makes it easier to document. Teams record everything in a structured format. Creating a visual representation helps everyone see the workflow. Teams discuss and adjust the information as needed. They identify areas for improvement and monitor changes.
Note: Teams should involve people who perform the process daily. Their insights help make the map accurate and useful.
Sequence Steps
Teams sequence steps to show how the process flows. They pinpoint the process they aim to document. Sequencing begins once teams have a clear understanding of the process.
Draft the process in its sequential or parallel order.
Expect to modify the map several times, adding or removing steps as necessary.
Use standard flowchart symbols to represent the workflow.
Teams use shapes and arrows to show relationships between inputs, actions, and outputs. Involving team members in the mapping process ensures accuracy. Reviewing the process map with the team helps confirm the sequence.
Involve team members in the mapping process.
Use shapes and arrows to represent relationships between inputs, actions, and outputs.
Review the process map with your team to ensure accuracy.
Teams should expect to revise the sequence as they learn more. Accurate sequencing helps teams visualize the workflow and spot areas for improvement.
Select Map Type
Teams choose the right process map based on the purpose of their analysis and the complexity of the business process. Each type of map serves a different function and helps organizations reach operational excellence.
Process flowcharts work best for simple and straightforward processes. They help teams see the main steps quickly.
Swimlane diagrams clarify responsibilities by dividing tasks among teams or departments. These diagrams show who does what at each stage.
Value stream maps offer a detailed layout for in-depth analysis. Managers often use these maps to find waste and improve efficiency.
SIPOC diagrams provide a simplified overview. They highlight key participants and the main steps without too much detail.
Teams should match the map type to their goals. A simple process may only need a flowchart, while a complex process with many handoffs may require a swimlane diagram or value stream map.
Draw Map
Teams use visual tools to create clear and accurate process maps. Many software platforms help teams build, edit, and share these diagrams.
Lucidchart allows teams to work together on process maps and flowcharts.
Microsoft Visio offers professional templates for many types of business diagrams.
Creately supports visual collaboration for modeling and improving processes.
EdrawMax provides a large library of templates for different mapping needs.
Camunda connects process modeling with automation features.
Bizagi uses BPMN standards for creating and improving business processes.
SAP Signavio helps large organizations document and improve their processes.
ARIS supports large-scale process optimization projects.
iGrafx includes tools for value stream mapping and process intelligence.
KaiNexus documents and analyzes process steps for improvement.
eVSM focuses on capturing and improving value streams.
Planview manages process mapping for software delivery teams.
Teams should select a tool that fits their needs and budget. Most tools offer drag-and-drop features, templates, and collaboration options.
Teams start by placing the main steps in order. They use standard symbols for actions, decisions, and connections. Labels make each step clear. Teams add details as needed, but they avoid clutter. A neat and organized map helps everyone understand the process.
Validate
Validation ensures the process map matches the real workflow. Teams use structured techniques to check for accuracy and spot risks.
Validation Technique | Description |
|---|---|
Failure Modes Effect Analysis (FMEA) | Assesses risks involved with a solution and helps refine it before implementation. |
Mistake-proofing (Poka-Yoke) | Ensures that the proposed solution does not create additional defects or errors. |
Teams review the map with people who do the work every day. They ask questions and look for missing steps or unclear areas. Teams use FMEA to find possible failures and fix them before making changes. Mistake-proofing helps teams design processes that avoid errors.
Teams should update the map based on feedback. A validated map gives a strong foundation for process improvement.
Refine
Refining a process map is a crucial step that ensures accuracy and clarity before implementation. Teams often find that the first version of a process map covers most scenarios, but not all. As they review and discuss the map, new details and improvements emerge.
Note: Initial process maps usually address about 70-80% of real-world situations. Teams should expect to refine the map as their understanding grows.
The refinement process involves several key actions:
Review the process map with the entire team. Each member brings unique insights and can spot missing or outdated steps.
Collect feedback from those who work directly with the process. These frontline teams often identify gaps and inefficiencies that others might miss.
Make necessary changes based on the feedback. This may include adding missing steps, removing outdated actions, or clarifying responsibilities.
Update roles and responsibilities to reflect current workflows. Clear assignments help prevent confusion and ensure accountability.
Repeat the review process as needed. Teams should continue refining the map until everyone agrees on the final version.
Teams can use the following checklist to guide their refinement efforts:
Validate the map with frontline staff.
Ask for input on missing or outdated elements.
Ensure all responsibilities match current practices.
Confirm that the map is easy to understand and follow.
Tip: Treat feedback as an opportunity for improvement. Each round of refinement brings the process map closer to an accurate and effective tool.
A well-refined process map supports better decision-making and smoother implementation. Teams that invest time in this step set themselves up for long-term success.
Using Your Process Map
Once a process map is complete, systems and teams can use it to drive real improvements. A well-documented map helps everyone understand the workflow, making it easier to share, train, and keep processes up to date.
Share Map
Sharing the process map ensures that all team members and stakeholders have access to the same information. Systems and teams often use digital tools to distribute maps, allowing for real-time updates and collaboration. Visual maps can be posted in shared workspaces, included in onboarding materials, or integrated into project management platforms. This transparency helps everyone follow the same steps and reduces confusion.
Tip: Use clear visuals and simple language in process maps to make them accessible to all team members, regardless of experience.
Train Teams
Training is essential for teams to use process maps effectively. Systems and teams that invest in training see better results and smoother operations. Training should cover the basics of process mapping, how to spot waste, and how to suggest improvements. Hands-on practice, group discussions, and real examples from the team's own work help reinforce learning. Ongoing training, such as regular workshops or short refresher courses, keeps skills sharp and ensures everyone stays up to date.
Training covers process mapping basics, waste identification, and improvement suggestions.
Sessions include hands-on practice, group discussions, and real work examples.
Ongoing workshops or refresher courses help maintain and update skills.
When teams understand how to use process maps, they can identify problems faster and suggest better solutions. This leads to more efficient systems and improved outcomes for clients.
Monitor & Update
Process maps are living documents. Systems and teams must review and update them regularly to reflect changes in workflows or business needs. Regular reviews help teams keep their processes effective and up to date. Teams that review and update their process maps often achieve significant improvements, such as a 30% reduction in cycle times. Tracking key metrics like cycle time and throughput helps teams know when to make changes.
Method | Description |
|---|---|
Regular Reviews | Frequent evaluations to identify issues and ensure alignment with current practices. |
Team Training | Ongoing education to enhance skills and improve efficiency. |
Management Support | Leadership involvement to foster a culture of continuous improvement. |
Daily Practice | Integrating process maps into daily routines for relevance and accuracy. |
Digital Tools | Using technology for collaboration and real-time updates. |
By monitoring and updating process maps, systems and teams can adapt quickly to new challenges. This ongoing improvement ensures that processes remain efficient and effective, helping clients achieve better results over time.
Process Mapping Best Practices
Clarity
Clear process maps help systems and teams communicate workflows to their clients. Clarity ensures that everyone understands each step and role. Teams achieve clarity by following several guidelines:
Use simple language and avoid jargon. This makes maps easy for all team members and clients to read.
Limit the number of symbols and colors. Too many can confuse users and reduce map effectiveness.
Involve team members from different departments. Diverse perspectives help identify unclear areas and improve map quality.
Treat process maps as living documents. Regular reviews and updates keep maps accurate and relevant.
Use standardized symbols consistently. This enhances readability and helps clients follow processes without confusion.
Teams that focus on clarity create maps that guide clients through workflows smoothly. Clients benefit from reduced errors and faster onboarding.
Team Involvement
Team involvement plays a key role in creating effective process maps. Systems and teams engage stakeholders who participate in or oversee processes. Their input leads to accurate maps that reflect real business operations. Management also supports teams by providing frameworks, coaching, and clear objectives. This empowers teams and improves problem-solving.
Evidence | Explanation |
|---|---|
Engaging the right stakeholders is crucial. | Those who actively participate in or oversee a process have the best insights into how it functions and can provide valuable input. Their involvement helps create accurate, practical maps that truly reflect business operations. |
Management’s involvement in Quality Circles is multifaceted. | This includes providing frameworks, coaching support, and clear objectives, which empower teams and enhance their problem-solving capabilities, ultimately improving process mapping outcomes. |
When systems and teams involve everyone, clients receive processes that work well and adapt to their needs.
Tools & Templates
Choosing the right tools and templates helps systems and teams build process maps efficiently. Many tools offer features that support collaboration and customization. Commonly used tools include:
Lucidchart: Cloud-based with strong collaboration features and many templates.
Microsoft Visio: Advanced diagramming and integration with Microsoft Office.
Bizagi: BPM suite supporting process modeling and automation.
SmartDraw: Automated drawing and extensive templates.
Minitab Workspace: Combines process mapping with data analysis.
Draw.io (diagrams.net): Free, browser-based for quick diagrams.
Creately: Real-time collaboration and rich templates.
Signavio: Comprehensive BPM tool for large organizations.
Teams also use templates to streamline mapping. Popular templates include:
Lean Six Sigma DMAIC Process Flowchart
Teal Escalation Flowchart Template
Proposal Process Flowchart
Employee Termination Process Flowchart
Using the right tools and templates allows systems and teams to deliver clear, consistent maps. Clients benefit from faster implementation and improved process reliability.
Continuous Improvement
Continuous improvement stands as a core principle in effective process mapping. Teams that focus on ongoing enhancement see better results over time. They use process maps not just as static documents but as living tools that evolve with business needs.
Process mapping gives teams a clear visual of how work flows. This clarity helps them spot inefficiencies and areas that need change. Teams often find delays or redundant steps when they review these maps. By making small, regular updates, they keep processes efficient and aligned with company goals.
Key reasons why continuous improvement matters in process mapping include:
Process maps show workflows in a way that makes it easy to find inefficiencies.
Teams can see where delays or extra steps slow down progress.
Visual maps help everyone understand which parts of a process need attention.
Teams that use process mapping for continuous improvement also build a culture of collaboration. When everyone can see the workflow, team members feel encouraged to share ideas and insights. This open approach leads to better solutions and stronger teamwork.
Process mapping brings cross-functional teams together.
Team members can contribute their knowledge and suggest changes.
Collaboration increases transparency and trust within the organization.
Standardizing processes through mapping reduces errors and boosts efficiency. When teams update maps regularly, they make sure everyone follows the best way to do each task. This standardization supports ongoing improvement and helps the business reach its goals.
Standardized processes lower the risk of mistakes.
Regular updates keep workflows current and effective.
Teams can measure improvements and track progress over time.
Continuous improvement in process mapping means never settling for "good enough." Teams review their maps often, looking for ways to remove waste and fix bottlenecks. They align their efforts with organizational goals, making sure every change adds value.
Tip: Schedule regular process reviews. Even small changes can lead to big gains in efficiency and quality.
By making continuous improvement a habit, organizations stay agile and competitive. They adapt quickly to new challenges and keep their processes running smoothly. Process mapping becomes a powerful tool for lasting success.
Business process mapping gives teams clarity, efficiency, and standardization. Recent research shows that mapping helps identify bottlenecks, supports training, and drives informed decisions. Experts recommend understanding the current state, involving stakeholders, and validating maps in real work environments. Teams that follow these steps create strong foundations for improvement. For more guidance or support, readers can reach out to systems and teams to learn how process mapping can transform their operations.
FAQ
What is business process mapping?
Business process mapping creates visual diagrams that show how tasks move from start to finish. These maps help teams understand, analyze, and improve workflows.
Who should participate in process mapping?
Teams should include people who perform the process daily, managers, and stakeholders. Their input ensures the map reflects real work and identifies improvement areas.
How often should teams update process maps?
Teams should review and update process maps regularly. Major changes in workflow, technology, or team structure signal the need for updates.
What tools help with process mapping?
Popular tools include Lucidchart, Microsoft Visio, Bizagi, and Draw.io. These platforms offer templates, collaboration features, and easy sharing options.
Can process mapping help with compliance?
Yes. Process maps document workflows, making it easier for organizations to meet regulatory requirements and prepare for audits.
What is the difference between a flowchart and a swimlane diagram?
A flowchart shows the sequence of steps in a process. A swimlane diagram adds lanes to show who is responsible for each step.
Why is validation important in process mapping?
Validation checks if the process map matches real work. It helps teams find errors, missing steps, or unclear roles before making changes.
How does process mapping support training?
Process maps give new team members a clear visual guide. This reduces training time and helps them understand their roles quickly.


