Business Processes Demystified with Real-World Examples

A business process is a series of steps that an organization follows to complete tasks and achieve specific goals. These processes form the backbone of business management, helping teams work smarter and reach targets in areas like sales and customer service. Research shows that well-structured business processes can reduce costs by 20% and improve customer satisfaction.
With the right knowledge, companies streamline workflows and boost outcomes. Real-world examples make these concepts easy to grasp and apply.
Key Takeaways
Business processes are clear, repeatable steps that help organizations reach goals efficiently and consistently.
There are three main types of business processes: core (create value), support (help core work), and management (guide the organization).
Designing, implementing, monitoring, and optimizing processes form a continuous cycle that improves performance over time.
Using technology and automation in processes saves time, reduces errors, and cuts costs significantly.
Strong business processes boost customer satisfaction by delivering fast, friendly, and reliable service.
Mapping processes helps teams spot delays and waste, leading to better communication and faster work.
Involving cross-functional teams and measuring progress with clear data ensures successful process improvements.
Avoid common mistakes like poor documentation and lack of training to keep process improvements on track.
What Are Business Processes
Definition
Business processes describe a set of linked activities that organizations use to achieve specific goals. Each process follows a clear sequence, guiding teams from the start of a task to its completion. Over time, the concept of business processes has evolved. Early businesses relied on simple tools for tasks like data entry and transactions. The Industrial Revolution introduced new ideas about efficiency, with leaders such as Frederick Taylor and Henry Ford shaping process optimization. In the mid-20th century, methods like Operations Research and Total Quality Management became popular. Later, Business Process Reengineering and workflow automation changed how companies worked. Today, organizations use advanced software, agile methods, and even artificial intelligence to manage and improve their processes. These changes show that business processes continue to adapt as technology and business needs grow.
Key Features
Business processes share several important features:
Clear Steps: Each process has defined steps that guide work from beginning to end.
Repeatability: Teams can repeat the same process many times with similar results.
Measurability: Organizations can measure how well a process works using time, cost, and quality metrics.
Goal Orientation: Every process aims to achieve a specific outcome, such as delivering a product or serving a customer.
Role Assignment: Each step in the process assigns tasks to specific people or teams.
Note: Well-defined business processes help companies find and remove waste, improve quality, and boost productivity.
A table below shows how organizations measure efficiency gains from strong business processes:
Technique | Description | Key Metrics / Outcomes |
|---|---|---|
Flow Analysis | Reviews process cycle time and efficiency, identifies non-value adding activities, calculates cycle efficiency and resource utilization. | Cycle time, cycle efficiency, resource utilization, cost allocation |
Queuing Theory | Mathematical study of congestion and delays to optimize resource allocation and service levels. | Waiting times, congestion levels, resource requirements |
Process Simulation | Models current processes and tests 'What-If' scenarios to identify optimal future state processes. | Process performance under different scenarios (time, cost, quality) |
Importance
Business processes play a vital role in helping organizations reach their goals. They provide structure, making it easier for teams to work together and deliver consistent results. Statistical reports show that companies using process management tools see fewer errors and better decision-making. For example, 74% of businesses have increased their interest in process management, and 70% use at least one tool to manage their processes. Automation saves nearly half of the time for IT and engineering leaders, and 51% report cost savings. Companies that formalize their processes often see higher returns on investment.
Tip: Inefficient manual processes can cost businesses over $1 million each year. Improving these processes leads to better quality, faster service, and happier employees.
A 2020 survey found that 84% of teams plan to invest more in automation to improve their business processes. Leaders report that better processes reduce costs, increase speed, and improve quality. Employees also feel more motivated when they help improve how work gets done. These benefits show why business processes matter for every organization.
Types of Business Processes
Core Processes
Core processes form the foundation of any organization. These processes directly create products or deliver services that customers value. For example, in a manufacturing company, core processes include product design, production, and delivery. In a retail business, they involve purchasing goods, stocking shelves, and selling to customers. Core processes focus on activities that generate revenue and drive growth.
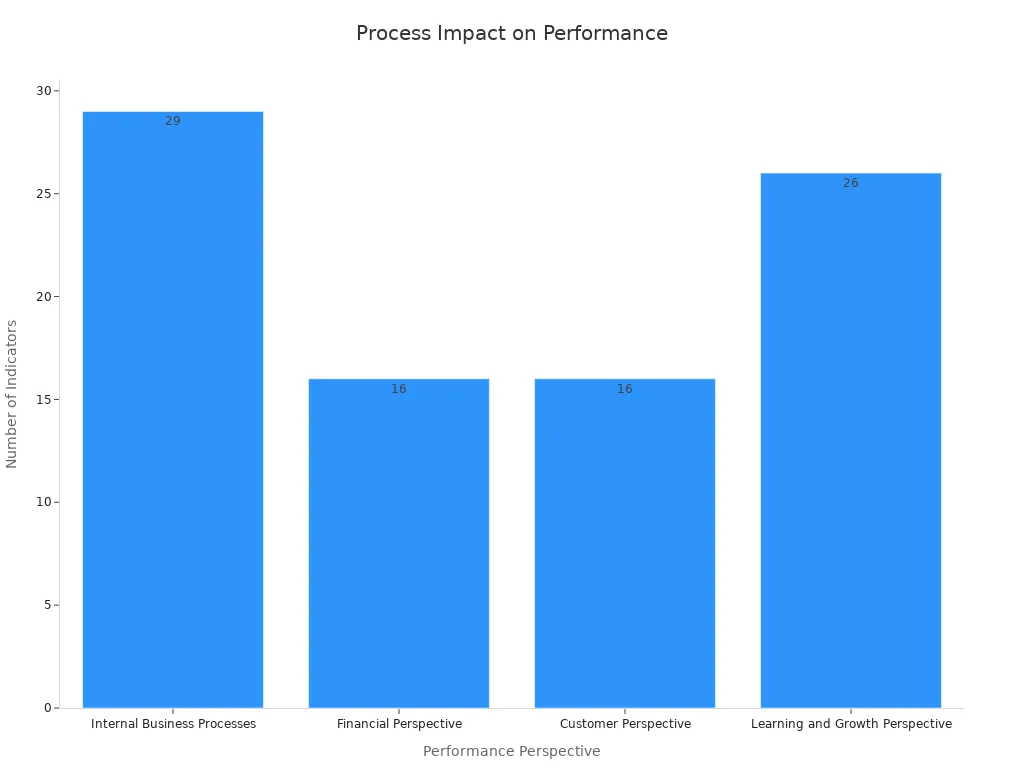
Researchers have found that core processes play a central role in production and development. They connect closely to the organization’s main goals and help deliver value to customers. Companies often measure the performance of core processes using indicators such as process time, cost, quality, and productivity. These measures help leaders identify areas for improvement and ensure that the business stays competitive.
Performance Perspective | Number of Indicators | Key Quantitative Measures / Focus Areas |
|---|---|---|
Internal Business Processes | Process time, cost, quality, flexibility, productivity | |
Financial Perspective | 16 | Sales, revenues, financial performance for shareholders and management |
Customer Perspective | 16 | Customer satisfaction, complaints, delivery reliability, query time |
Learning and Growth Perspective | 26 | Employee performance, innovation, creativity, digital innovation |
Note: Core processes often receive the most attention in performance measurement because they have a direct impact on customer satisfaction and financial results.
Support Processes
Support processes help core processes run smoothly. These activities do not directly create products or services, but they provide essential support. Examples include human resources, IT support, and facility management. In many organizations, support processes handle tasks like hiring employees, maintaining equipment, and managing payroll.
Support processes also include customer service functions. These roles focus on assisting customers and maintaining service quality. For instance, IT support teams manage incident and problem resolution. By separating support from core activities, organizations can improve workflow efficiency and ensure that each team focuses on its strengths.
A recent study shows that support processes, including customer service, play a key role in maintaining high service standards. They help organizations respond quickly to issues and keep operations running smoothly. This separation of duties leads to better results for both employees and customers.
Management Processes
Management processes guide the direction of the organization. These processes include planning, monitoring, and controlling business activities. Leaders use management processes to set goals, allocate resources, and make strategic decisions. Examples include budgeting, performance reviews, and compliance checks.
Management processes ensure that the organization operates efficiently and meets regulatory requirements. They also help leaders track progress and adjust strategies as needed. Research highlights that management processes support cross-functional integration and innovation. By focusing on process management and measurement, organizations can improve their ability to adapt and grow.
A large-scale survey of over 14,000 business processes across industries confirms that organizations benefit from clear distinctions between core, support, and management processes. This structure helps companies achieve higher performance and adapt to changing business needs.
Customer Service Processes
Customer service processes guide how organizations interact with customers before, during, and after a sale. These processes help companies answer questions, solve problems, and build strong relationships with their clients. Many businesses see customer service as a key part of their success. Good customer service can turn a one-time buyer into a loyal customer.
Customer service processes often include several important steps. First, a company receives a customer inquiry. This might come through a phone call, email, website chat, or social media message. Next, a team member reviews the request and gathers information. The employee then works to solve the problem or answer the question. After resolving the issue, the company may follow up to make sure the customer feels satisfied.
Note: Fast and friendly responses help customers feel valued and respected.
Companies use different tools to manage customer service processes. Many use help desk software to track requests and assign tasks to the right team members. Some businesses use automated chatbots to answer simple questions. Others rely on detailed scripts to make sure every customer gets the same high-quality service.
A table below shows common channels for customer service and their main features:
Channel | Speed of Response | Personal Touch | Common Use Cases |
|---|---|---|---|
Phone | Fast | High | Urgent issues, complaints |
Moderate | Medium | Detailed questions, follow-up | |
Live Chat | Very Fast | Medium | Quick help, website support |
Social Media | Fast | Low | Public feedback, updates |
Customer service processes differ from core, support, and management processes. Core processes focus on making and delivering products. Support processes help with tasks like hiring or IT. Management processes guide planning and control. Customer service processes, however, focus on the customer’s experience and satisfaction.
Many organizations measure the success of their customer service processes. They track metrics such as response time, resolution rate, and customer satisfaction scores. These numbers help leaders find areas for improvement.
Tip: Companies that invest in strong customer service processes often see higher customer loyalty and better reviews.
Customer service processes continue to evolve. New technology, such as artificial intelligence and self-service portals, helps companies serve customers faster and more efficiently. Still, the human touch remains important. Employees who listen and respond with care make a big difference in how customers feel about a company.
Business Processes Lifecycle
Design
The design stage sets the foundation for effective business processes. Teams start by establishing clear goals and identifying areas that need improvement. They often map out current workflows to spot inefficiencies and plan changes that align with business objectives. This stage includes documenting each step, assigning roles, and creating visual models of the process. Many organizations use process mapping tools to make these diagrams easy to understand. During design, leaders also consider how technology or automation can help. By focusing on these elements, companies ensure that their processes support overall strategy and prepare for future growth.
A typical lifecycle begins with design, followed by modeling, execution, monitoring, and optimization. Research shows that 67.5% of organizations know how to manage business processes from design to implementation. This strong start helps teams avoid confusion and sets the stage for successful execution.
Implementation
Implementation brings the designed process to life. Teams put the new workflow into action, assign tasks, and integrate any necessary technology. Many organizations start with a small-scale rollout to test the process and gather feedback. This approach allows them to make adjustments before a full launch. During implementation, leaders monitor adoption and provide training to ensure everyone understands their roles.
Empirical studies highlight the benefits of structured implementation. For example, German service firms that adopted business process management and supporting technologies saw improvements in process quality. International surveys also show that using best practices, such as ITIL, leads to better alignment between business and IT teams. Companies often use maturity assessment models to guide their progress and share best practices across departments. These steps help organizations achieve higher operational benefits and smoother transitions.
Monitoring
Monitoring ensures that business processes deliver the expected results. Teams track key performance indicators (KPIs) such as cycle time, error rates, throughput, and customer satisfaction. Real-time tracking helps identify bottlenecks and areas for improvement. Common metrics include the number of workflows launched, completed, or active, as well as error rates and productivity indicators. Efficiency metrics like contract lifecycle time and turnaround time provide insight into how quickly tasks move through the process.
Organizations also monitor performance metrics such as annual contract value and order value variance. These numbers help leaders detect issues like fraud or resource gaps. Monitoring supports continuous improvement by providing data for iterative changes. Many companies use dashboards and automated alerts to keep everyone informed. This focus on measurement and feedback helps teams refine their processes and achieve better outcomes.
Tip: Regular monitoring not only detects problems early but also supports compliance and enhances customer satisfaction.
Optimization
Optimization helps organizations get the most out of their processes. Teams look for ways to make each step faster, cheaper, or more reliable. They use data from the monitoring stage to spot problems and find areas that need improvement. Optimization does not happen once. It is a continuous effort that keeps processes up to date and effective.
Many companies use a cycle called "continuous improvement." This approach encourages teams to review and adjust their workflows regularly. The most popular method is the PDCA cycle, which stands for Plan, Do, Check, Act. Teams plan changes, try them out, check the results, and then act on what they learn. This cycle repeats as teams look for new ways to improve.
Tip: Small changes can lead to big results over time. Teams should focus on one improvement at a time and measure the impact before moving on.
Common optimization techniques include:
Eliminating Waste: Teams remove steps that do not add value. This makes the process leaner and faster.
Automating Tasks: Companies use software or machines to handle repetitive work. Automation reduces errors and saves time.
Standardizing Procedures: Teams create clear instructions for each task. Standardization helps everyone follow best practices.
Using Feedback: Employees and customers share ideas for improvement. Their feedback helps teams find problems that data might miss.
A table below shows some tools and methods used for process optimization:
Tool/Method | Purpose | Example Use Case |
|---|---|---|
Lean | Remove waste, increase value | Streamlining order processing |
Six Sigma | Reduce errors, improve quality | Lowering defect rates in production |
Automation Software | Speed up tasks, cut costs | Automating invoice approvals |
Benchmarking | Compare with best practices | Matching top industry standards |
Teams often use technology to support optimization. Dashboards show real-time data, making it easier to spot trends and issues. Some companies use artificial intelligence to predict problems before they happen. Others use workflow tools to test new ideas without disrupting daily work.
Note: Optimization is not just about cutting costs. It also helps teams deliver better quality and improve customer satisfaction.
Successful optimization depends on teamwork. Leaders encourage employees to share ideas and take part in improvement projects. When everyone works together, organizations can adapt quickly and stay ahead of the competition.
Examples

Order Fulfillment
Order fulfillment stands as a classic example of business processes in action. Companies receive customer orders, check inventory, pick products, pack them, and ship to the customer. Each step must work smoothly to keep customers happy and costs low. Many businesses use technology to track orders and manage inventory. This helps prevent mistakes and speeds up delivery.
Key improvements in order fulfillment include:
Accurate inventory tracking and demand forecasting prevent stockouts and lost sales.
Standardized workflows reduce manual errors and delays.
Clear communication with suppliers and customers leads to fewer miscommunications.
Monitoring supply chain KPIs, such as perfect order rate, helps spot inefficiencies.
Workforce training increases fulfillment accuracy.
Data-driven decisions help predict demand and allocate resources.
Statistics show the impact of these improvements:
165 billion packages ship each year in the US, showing the scale of order fulfillment.
The average cost to fulfill an order is 70% of the order value.
63% of consumers cancel purchases due to high shipping fees.
38% abandon orders if delivery takes longer than a week.
69% will not reorder if delivery is more than two days late.
24% abandon purchases if no delivery date is given.
Packages may be handled 20 times or more, raising the risk of errors.
74% of shoppers want free shipping, and 94% act to get it.
These facts highlight why companies must focus on speed, cost, and accuracy in their business processes.
Employee Onboarding
Employee onboarding introduces new hires to a company’s culture, tools, and expectations. A strong onboarding process helps new employees feel welcome and become productive faster. The steps often include paperwork, training, meeting team members, and learning job tasks.
Companies measure onboarding success with several metrics:
Time to productivity
Skill assessments and quizzes
New hire retention rates per manager
A Glassdoor study found that good onboarding can improve productivity by up to 70%. Tracking these metrics helps companies find strengths and weaknesses in their onboarding business processes. When new hires feel supported, they stay longer and perform better.
Invoice Processing
Invoice processing covers the steps from receiving an invoice to paying it. Many companies use automation software to handle invoices. This reduces errors and saves time.
Metric | Value | Description |
|---|---|---|
Efficiency improvement factor | Potential increase in invoice processing efficiency through automation | |
Processing cost reduction | Lower costs due to automation software | |
Cycle time reduction | Weeks to hours | Faster invoice processing with automation |
Manual data entry error rate | 3.6% | Error rate in manual entry, reduced by automation |
Automated invoice processing helps companies pay bills on time, avoid late fees, and keep good relationships with suppliers. These improvements show how business processes can boost efficiency and cut costs.
Customer Support
Customer support stands as a vital process in many organizations. Companies use customer support to solve problems, answer questions, and build trust with their clients. This process often starts when a customer reaches out for help. The request may come through a phone call, email, live chat, or even social media.
A typical customer support process includes several steps:
Receiving the Request: The company receives a message or call from the customer.
Identifying the Issue: The support agent listens and gathers information about the problem.
Finding a Solution: The agent checks resources or asks other team members for help.
Resolving the Issue: The agent provides an answer or fixes the problem.
Following Up: The company checks if the customer feels satisfied with the solution.
Tip: Fast and friendly responses help customers feel valued and respected.
Many companies use software to track support requests. This software assigns tickets to agents and keeps a record of each case. Some businesses use chatbots to answer simple questions. Others rely on human agents for more complex issues.
A table below shows common support channels and their main features:
Channel | Speed | Personal Touch | Best Use Cases |
|---|---|---|---|
Phone | Fast | High | Urgent or complex issues |
Moderate | Medium | Detailed questions | |
Live Chat | Very Fast | Medium | Quick help, website |
Social Media | Fast | Low | Public feedback |
Customer support teams measure their success using key metrics. These include:
First Response Time: How quickly the team replies to a customer.
Resolution Rate: The percentage of issues solved on the first try.
Customer Satisfaction Score (CSAT): How happy customers feel after support.
Net Promoter Score (NPS): How likely customers are to recommend the company.
Note: High customer satisfaction often leads to repeat business and positive reviews.
Real-world example: A retail company receives a complaint about a late delivery. The support agent checks the order status, contacts the shipping partner, and updates the customer. After solving the issue, the agent follows up to ensure the customer feels satisfied. This process helps the company keep its reputation strong.
Customer support continues to change with new technology. Many companies now use artificial intelligence to suggest answers or spot common problems. However, the human touch remains important. Agents who listen and show empathy make a big difference in customer loyalty.
Benefits
Efficiency
Efficiency stands as one of the most important benefits of strong business processes. When companies design and optimize their workflows, they save time and resources. Teams can complete tasks faster and with fewer mistakes. This leads to lower costs and higher profits. Many organizations use technology and data to improve efficiency. For example, companies like Walmart, W3O, and Netflix have seen major gains by analyzing data and automating steps.
Company | Quantitative Evidence of Efficiency Improvement | Outcome/Impact |
|---|---|---|
Walmart | Analyzed a terabyte of customer purchase history to predict demand during Hurricane Frances | Rapid stocking of key items; increased profits |
W3O | Implemented construction cost management software, improving real-time project and financial control | Turnover increased from R200 million to projected R800 million within a year |
Netflix | Developed a recommendation algorithm based on detailed user behavior metrics | Nearly 80% of users followed recommendations, boosting retention rates |
These examples show how efficient business processes help companies respond quickly to changes, manage resources better, and serve customers faster.
Tip: Efficient processes reduce waste and free up time for teams to focus on important work.
Consistency
Consistency means delivering the same high-quality results every time. Streamlined business processes help teams follow clear steps, which reduces errors and confusion. Many companies use methods like Lean Management, Six Sigma, and Total Quality Management to improve consistency. These approaches focus on removing waste, reducing defects, and standardizing work.
Methodology/Aspect | Description/Principles | Evidence of Consistency Outcomes |
|---|---|---|
Lean Management | Optimizes resources, eliminates waste, continuous improvement. | Streamlined workflows reduce defects and delays, improving quality and consistency. |
Six Sigma | Aims for near-perfect quality with 3.4 defects per million opportunities. | Statistical evidence of defect reduction leading to consistent high-quality outputs. |
Business Process Reengineering | Overhauls processes to improve quality, speed, and costs. | Large-scale improvements in process efficiency and output consistency. |
Total Quality Management (TQM) | Focuses on customer, employee involvement, and data-driven decisions. | Sustains consistent process outcomes through empowered teams and communication. |
Agile | Uses regular feedback and adaptation. | Continuous refinement leads to consistent and improved process performance. |
Kaizen | Empowers employees and eliminates waste. | Standardization and process stability enhance consistency. |
Theory of Constraints (TOC) | Removes bottlenecks to improve flow. | Smoother, more reliable processes. |
Business Process Management | Uses analytics and software to manage and improve processes. | Up to 50% reduction in completion time, 30% cost reduction, and 25% cycle time improvement. |
Automation (RPA, BPA) | Automates repetitive tasks. | Up to 50% cost savings; 90% RPA adoption, enhancing process consistency. |
Communication & Employee Involvement | Open communication and engagement. | Reduces confusion and errors, sustaining consistent execution. |
Customer Focus | Designs processes with customer impact in mind. | Faster service, improved quality, and higher satisfaction due to consistent outputs. |
A study from the BPM Center of Excellence found that a multinational company cut costs by 30% and improved cycle times by 25% after using streamlined process management. Reports from Gartner and Deloitte show that automation can save up to 50% in costs and that 90% of organizations use automation to improve reliability. These results prove that consistent business processes lead to better quality and fewer mistakes.
Compliance
Compliance means following rules, laws, and standards. Strong business processes help companies meet these requirements. Teams use different tools to check if their work meets the right standards. Statistical Process Control (SPC) uses control charts to monitor ongoing work. Capability analysis checks if a process meets set standards. Trend analysis looks for patterns that show if a process stays stable or improves. Variance analysis (ANOVA) helps teams see how different factors affect results. Performance metrics track changes in yield, processing time, and quality. Cost impact evaluations measure how changes affect costs and resource use.
Statistical Process Control (SPC) methods such as control charts are used for ongoing process monitoring.
Capability analysis evaluates the process to confirm it meets required standards.
Trend analysis detects patterns over time that indicate process stability or improvement.
Variance analysis (ANOVA) assesses the impact of different parameters on process outcomes.
Performance metrics analysis includes yield variations, processing time deviations, and quality trends to quantify improvements.
Cost impact evaluations measure production cost changes and resource utilization efficiency.
These methods help companies prove that their business processes work well and follow all rules. By using these tools, organizations avoid fines, protect their reputation, and build trust with customers and regulators.
Customer Satisfaction
Customer satisfaction stands as a key benefit of well-designed processes. When companies create clear steps for handling customer needs, they build trust and loyalty. Customers want fast service, accurate answers, and friendly support. Companies that deliver these things often see higher ratings and repeat business.
Many organizations use surveys to measure how happy customers feel. They ask questions about speed, helpfulness, and overall experience. High scores show that the company meets or exceeds expectations. Low scores signal problems that need fixing. Companies track these results over time to spot trends and make improvements.
A table below shows common ways companies measure customer satisfaction:
Metric | What It Measures | Why It Matters |
|---|---|---|
Customer Satisfaction Score | How happy customers feel after service | Shows overall experience |
Net Promoter Score (NPS) | Likelihood to recommend the company | Predicts loyalty and growth |
First Response Time | How quickly support answers | Fast replies build confidence |
Resolution Rate | Percentage of issues solved | High rates mean fewer problems |
Tip: Quick responses and clear communication help customers feel valued.
Companies often use technology to improve satisfaction. For example, chatbots answer simple questions at any time. Automated systems track orders and send updates. These tools help customers get information without waiting. However, many people still want to talk to a real person for complex issues. Companies train staff to listen, show empathy, and solve problems.
Satisfied customers share their good experiences with friends and family. They leave positive reviews online. This word-of-mouth helps companies attract new business. On the other hand, unhappy customers may leave negative feedback. Companies that respond quickly and fix problems can turn a bad experience into a good one.
A few simple steps help companies boost customer satisfaction:
Set clear expectations for service and delivery.
Train employees to handle requests with care.
Use feedback to find and fix weak spots.
Reward teams for excellent service.
Note: Happy customers stay longer, spend more, and help companies grow.
Improvement
Process Mapping
Process mapping gives organizations a clear view of how work flows from start to finish. Teams use diagrams to show each step, making it easier to spot delays, bottlenecks, or wasted effort. When companies map their processes, they often see big gains in efficiency and clarity.
McKinsey & Company found that process mapping led to 20% to 30% improvements in operational efficiency.
Forrester Research reported up to 25% lower operational costs after mapping and optimizing workflows.
Standardized procedures across departments improved collaboration and reduced confusion.
Mapping customer service workflows resulted in faster response times and higher satisfaction.
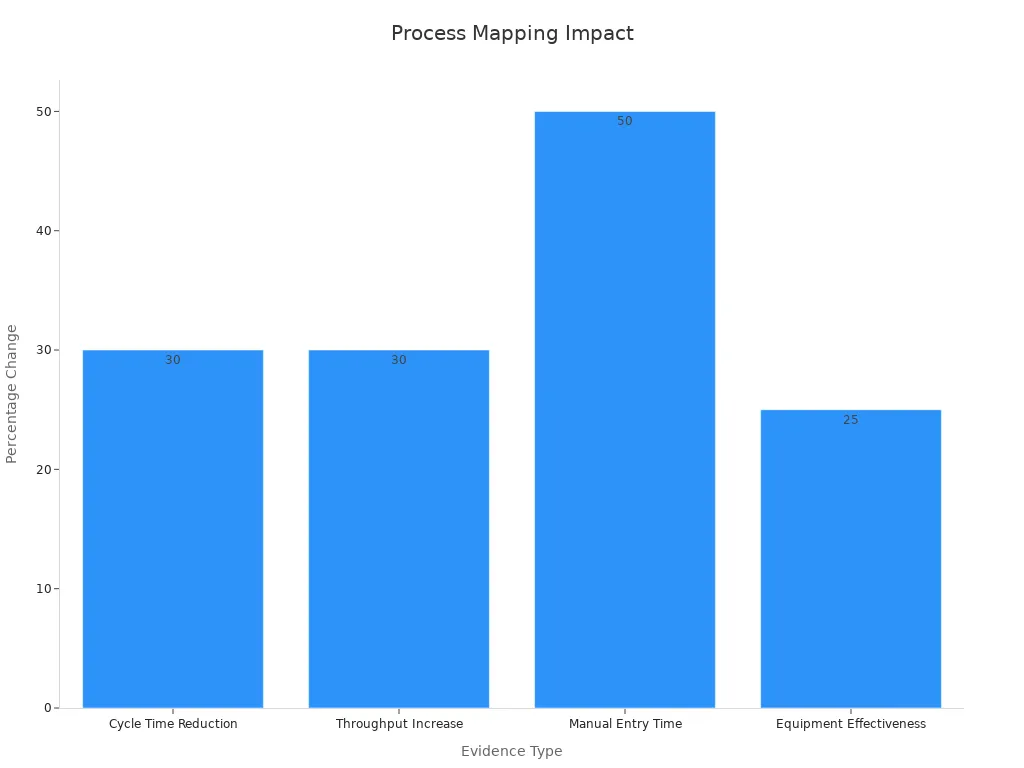
A table below highlights the impact of process mapping:
Evidence Type | Description |
|---|---|
Cycle Time Reduction | 30% decrease in cycle times by simplifying approval layers and workflows. |
Throughput Increase | 30% improvement in throughput after bottleneck identification. |
Resource Allocation | Optimized staffing and resource use, reducing idle time. |
Manual Entry Time | 50% reduction in manual entry time through automation. |
Equipment Effectiveness | 25% increase in equipment effectiveness in pharmaceutical production. |
Process mapping also helps teams break down silos, clarify roles, and create a shared understanding. This transparency supports accountability and enables data-driven decisions for continuous improvement.
Best Practices
Successful organizations use proven methods to improve business processes. They rely on structured approaches like Six Sigma, Lean, Kaizen, and the PDCA cycle. These methods focus on measuring performance, finding root causes, and testing solutions before making changes.
Continuous improvement uses data to solve problems and make decisions.
Key metrics include Overall Equipment Effectiveness (OEE), cycle time, defect rate, first pass yield, and cost of poor quality.
Customer satisfaction scores and employee engagement metrics help track progress.
Reliable data collection ensures that improvements are based on facts, not guesses.
Modern tools like Qntrl and Promapp support these efforts by making it easier to document and monitor changes.
Studies show that organizations using structured techniques reach improvement goals 60% faster than those without a plan. By measuring results and involving employees, companies can identify inefficiencies and sustain quality gains over time.
Common Pitfalls
Many teams face challenges when refining business processes. Some common pitfalls include:
Lack of documentation causes confusion and inconsistency.
Underestimating technology leads to missed efficiency gains.
Neglecting employee training results in failed improvements.
Not measuring progress regularly hides underperformance.
Ignoring change management creates resistance among staff.
Failing to set clear goals makes it hard to track success.
Overcomplicating processes increases confusion and slows work.
Ignoring employee input misses valuable insights from those closest to the work.
Tip: Teams should document every step, use the right technology, train employees, and measure progress. Involving staff and setting clear goals helps avoid these pitfalls and ensures lasting improvements.
Applying Insights
Identifying Processes
Organizations start by identifying which processes matter most. They look for activities that run most often or handle the largest number of transactions. These processes often have the biggest impact on cost, quality, and customer satisfaction. Teams also examine how different applications interact with each process. This helps them manage changes and stay compliant with regulations.
The Balanced Scorecard framework guides many organizations in this step. It encourages leaders to align process metrics with strategic goals. By doing so, managers can see how well each process supports the company’s mission. The framework covers four main areas: financials, customer relations, internal processes, and learning and growth.
Metric Category | Description | Examples |
|---|---|---|
Measure how well a process achieves intended results, focusing on quality and outcomes. | Customer satisfaction, error rate | |
Process Control Metrics | Monitor compliance and conformance to ensure processes operate within acceptable parameters. | Compliance rate, risk incidents |
Continuous Improvement Metrics | Assess impact of changes and quantify benefits of process improvements. | Cost savings, cycle time reduction |
Operational Efficiency Metrics | Determine time and resources needed to deliver products or services. | Cycle time, throughput |
Quality Metrics | Measure quality levels in operations. | Defect rates, return rates |
Cost Metrics | Identify total cost of producing goods or services to manage expenses and profitability. | Cost of goods sold, cost variance |
Capacity Metrics | Ensure teams and individuals have sufficient resources to complete tasks successfully. | Task assignments, capacity utilization |
Tip: Focusing on the most-used and most-complex processes helps organizations maximize their return on improvement efforts.
Team Involvement
Cross-functional teams play a key role in identifying and improving business processes. These teams bring together people from different departments, such as purchasing, manufacturing, and IT. By working together, they share knowledge and spot problems that might go unnoticed in a single department.
A three-year study at a large manufacturer showed that cross-functional teams improved coordination and decision-making. They helped align goals across departments and made sourcing decisions more effective. However, too much interaction sometimes led to information overload or conflicting priorities. The study found that involving suppliers in these teams increased speed and competitive advantage, but also required careful management.
Cross-functional teams enable better communication and holistic decision-making.
Involving suppliers can boost innovation and resource efficiency.
Teams must balance collaboration with clear roles to avoid confusion.
Note: Teams that include members from different functions often identify key processes faster and create more effective solutions.
Measuring Success
Measuring the success of process improvements relies on accurate and consistent data. Organizations track metrics such as data accuracy, completeness, and consistency. High-quality data leads to better decisions and more efficient operations. Early detection of errors reduces manual correction costs and improves compliance.
Many industries use these measurements to validate their business processes. For example, finance companies focus on fraud elimination, healthcare tracks patient record accuracy, and telecom firms monitor billing precision. Retailers use data to streamline operations and improve customer trust.
70% of organizations cite data quality as their biggest challenge.
53% prioritize improving data quality to support better decisions.
Automated tools, like SAP Signavio Process Insights, provide fast and ongoing feedback for process optimization.
Tip: Reliable data and regular measurement help organizations spot trends, prevent errors, and maintain customer trust.
Business processes help organizations achieve goals by providing structure, clarity, and efficiency. Real-world examples show how mapping workflows uncovers bottlenecks, improves communication, and supports innovation.
Visual process maps allow teams to understand steps quickly and make better decisions.
Key benefits include:
Improved compliance and risk management
Support for automation and ongoing improvement
Organizations can start by collecting feedback, aligning process maps with business goals, and involving stakeholders at every step.
Benefit | Description |
|---|---|
Explicit instructions for all stakeholders | |
Increased Control | Better compliance and process execution |
Lower Costs | Streamlined steps reduce expenses |
Start mapping or refining business processes today to drive efficiency, clarity, and long-term success.
FAQ
What is a business process?
A business process is a set of steps that an organization follows to complete a task or reach a goal. Each process has a clear beginning and end.
Why do companies map their business processes?
Companies map processes to see how work flows. This helps teams find delays, remove waste, and improve quality. Mapping also makes training easier.
How does automation improve business processes?
Automation uses technology to handle repetitive tasks. Teams save time, reduce errors, and focus on more important work. Many companies see lower costs and faster results.
What is the difference between core and support processes?
Core processes create products or services for customers. Support processes help core activities run smoothly. For example, payroll supports production but does not make products.
How can teams measure process success?
Teams use key metrics like cycle time, error rate, and customer satisfaction. A simple table shows common metrics:
Metric | What It Shows |
|---|---|
Cycle Time | Speed of completion |
Error Rate | Mistake frequency |
Satisfaction | Customer happiness |
What are common mistakes in process improvement?
Teams often skip documentation, ignore feedback, or forget to train staff. These mistakes lead to confusion and slow progress.
Can small businesses benefit from process management?
Yes. Small businesses gain clarity, save time, and improve service by managing processes. Even simple changes can make a big difference.


