Business Process Mapping steps to boost your workflow

Business Process Mapping gives organizations a clear way to visualize each step in their workflow. Many companies face challenges like limited resources, lack of formalized processes, and resistance to new technology. These issues often create confusion for clients and customers. By using process mapping, organizations can identify problems and take optimization steps that improve efficiency and consistency.
Key Takeaways
Business Process Mapping helps visualize workflows, making it easier to identify problems and improve efficiency.
Setting clear goals is crucial. It keeps teams focused on what matters most and aligns efforts with business objectives.
Use the SMART method to define success metrics. This ensures goals are specific, measurable, actionable, relevant, and time-bound.
Select high-impact processes to map first. Focus on areas that can lead to significant improvements or cost savings.
Involve stakeholders in the mapping process. Their insights help create a complete view of workflows and identify key issues.
Regularly review and update process maps. This keeps them relevant and aligned with changing business needs.
Leverage automation to streamline workflows. It reduces manual tasks, speeds up processes, and lowers the chance of errors.
Foster a culture of continuous improvement. Encourage employees to suggest changes and regularly evaluate processes for better performance.
Business Process Mapping Objectives
Setting Clear Goals
Clear goals form the foundation of any successful Business Process Mapping initiative. Teams need to know what they want to achieve before they start mapping. Setting objectives helps everyone focus on the most important areas for improvement. Without clear goals, efforts may become scattered, and results may not align with what the organization needs.
Aligning with Business Outcomes
Business Process Mapping works best when objectives match the organization’s overall strategy. Teams should ask, “How will this process map help the company reach its goals?” When objectives align with business outcomes, everyone works toward common targets. This shared understanding improves collaboration and ensures that process changes support the company’s mission.
Tip: Business Process Mapping provides a clear picture of how work is done. This shared view helps teams align their efforts and work toward common organizational goals.
Defining Success Metrics
Success metrics show if the mapping project meets its goals. Teams should use measurable targets to track progress. The most effective way to set these goals is to follow the SMART method:
Specific: Define clear and detailed goals.
Measurable: Use numbers or data to track progress.
Actionable: Set realistic and achievable targets.
Relevant: Make sure goals support the organization’s strategy.
Time-bound: Set a deadline for reaching each goal.
KPIs are the quantifiable markers that indicate how closely a project aligns with its objectives. They convert lofty ambitions into tangible targets, offering a clear lens through which success is measured.
Why Objectives Matter
Objectives guide every step of Business Process Mapping. They help teams focus on what matters most and avoid wasting time on less important tasks. Setting objectives before starting the mapping process ensures that efforts target areas with the biggest impact on performance. Understanding the current level of performance also helps teams measure improvement over time.
Benefit | Explanation |
|---|---|
Clear understanding of workflows | Business Process Mapping provides a shared understanding of how work is done, aligning efforts. |
Focus on common goals | It helps teams work towards common objectives, enhancing collaboration and efficiency. |
Measurable value | Organizations can track improvements in operations, leading to better decision-making. |
Highlighting key workflows | Process maps identify workflows that impact revenue and efficiency, guiding focus on critical areas. |
Standardization | Promotes transparency and reduces errors, facilitating better communication among teams. |
Support for training | Visual documentation aids in onboarding new employees, helping them learn tasks quickly. |
Regular reviews | Keeping process maps updated ensures alignment with changing strategies and goals. |
Use of metrics | Organizations track time, cost, and performance indicators to measure success. |
Teams that set clear objectives can identify inefficiencies, foster a shared understanding, and ensure consistency in processes. By focusing on measurable outcomes, organizations can optimize workflows and achieve lasting improvements.
Identify Key Processes
Process Selection
Selecting the right processes to map can make a big difference in workflow improvement. Teams often look for processes that have the most impact on business goals. They focus on areas where changes can lead to better results, higher efficiency, or cost savings.
High-Impact Criteria
Teams use several criteria to decide which processes to map first. These criteria help them find the processes that matter most to the organization. The table below shows common criteria and their descriptions:
Criteria | Description |
|---|---|
Responsibilities | Who is accountable for the process? |
Objectives | What are the goals of the process? |
Activities | What tasks are performed in the process? |
Inputs | What resources are needed to execute the process? |
Outputs | What are the results of the process? |
Customers | Who benefits from the process? |
Risks and controls | What are the potential risks and how are they managed? |
Key performance indicators | How is the success of the process measured? |
By reviewing these criteria, teams can identify which processes drive the most value. They can also spot areas with high risk or those that affect many people.
Prioritization Steps
After identifying high-impact processes, teams need to set priorities. They often start by listing all possible processes. Next, they rank them based on how much each one affects business goals, customers, or costs. Teams may use scoring methods or group discussions to reach a decision. They focus on processes that show clear problems, such as delays or frequent errors. This approach helps teams use their time and resources wisely.
Tip: Start with processes that have visible issues or those that support key business functions. Quick wins can build momentum for larger changes.
Defining Process Boundaries
Clear boundaries help teams understand where a process starts and ends. This step prevents confusion and keeps the mapping focused. Teams usually follow these steps:
Define the purpose of mapping the process early in the project.
Identify the start and endpoints of the process.
Apply metrics to measure the success of each task or the whole process.
Set the scope of the project, including boundaries, start, and end points.
When teams set clear boundaries, they avoid mapping unnecessary steps. They also make it easier to measure results and track improvements. Business Process Mapping becomes more effective when everyone knows exactly what part of the workflow they are analyzing.
Gather Process Information

Stakeholder Input
Stakeholders provide essential insights during the information gathering phase. Teams identify both internal and external stakeholders to ensure a complete view of the process. Internal stakeholders include board members, executives, department managers, project team members, and regular employees. External stakeholders consist of customers, end-users, suppliers, vendors, government regulators, and local communities.
Stakeholder mapping helps teams visualize relationships and analyze influence. This strategic tool allows project managers to identify key players and develop targeted engagement strategies. Teams gain a deeper understanding of how each stakeholder affects the process.
Interviews and Surveys
Face-to-face solicitation, such as formal interviews and informal discussions, offers direct feedback from stakeholders. Teams ask questions about daily tasks, challenges, and suggestions for improvement. Surveys and statistical sampling provide broader input and help collect data from larger groups. These methods reveal patterns and highlight areas needing attention.
Note: Interviews uncover hidden issues and clarify process steps. Surveys capture opinions and measure satisfaction levels.
Observational Methods
Observational methods allow teams to watch processes in action. They record how employees complete tasks and note any delays or errors. This approach uncovers inefficiencies that may not appear in interviews or surveys. Teams use organizational documents and industry articles to compare current practices with best standards.
Observing real-world scenarios helps validate process maps.
Reviewing documents ensures accuracy and completeness.
Data Collection
Accurate data collection forms the backbone of Business Process Mapping. Teams start with a high-level overview and gradually add details. They use standard shapes and notation for clarity. Capturing relevant metrics, such as cycle times and error rates, helps measure performance.
Best practices for collecting process data include:
Engaging the right stakeholders for insights.
Regularly reviewing and updating process maps.
Testing and validating maps in real-world scenarios.
Maintaining clarity in process steps.
Gathering continuous feedback from employees.
Teams integrate process management tools to improve collaboration. They incorporate metrics and performance data to track progress. This approach ensures process maps remain relevant and useful.
Tip: Begin with a simple overview and add details as needed. Use recognized flowchart symbols for better understanding.
Collecting accurate information enables teams to visualize, analyze, and optimize workflows. This step supports ongoing improvement and helps organizations achieve their goals.
Business Process Mapping Techniques
Visual Mapping Methods
Flowcharts
Flowcharts remain one of the most popular tools for visually representing business processes. They use standardized symbols to show the sequence of steps, decisions, and outcomes. Teams often choose flowcharts for their simplicity and universal understanding. Flowcharts help identify bottlenecks and clarify the order of tasks. They work best for processes that follow a clear, linear path.
Technique | Implementation Complexity | Resource Requirements | Expected Outcomes | Ideal Use Cases | Key Advantages |
|---|---|---|---|---|---|
Flowchart Mapping | Low–Medium | Minimal | Clear sequential process visualization; bottleneck identification | Simple to moderately complex sequential processes | Universally understood; easy to create and modify; minimal training |
Swimlane Diagram (Cross-Functional) | Medium | Cross-functional input | Clear ownership and handoff visualization; dependency discovery | Multi-departmental processes requiring role clarity | Clarifies responsibilities; reveals communication bottlenecks; improves alignment |
Value Stream Mapping (VSM) | High | Significant | Identifies waste, quantifies cycle times, roadmap for improvement | Manufacturing/operations focused on waste elimination | Highlights value vs waste; quantifies improvements; aligns with lean |
BPMN (Business Process Model and Notation) | High | Specialized software | Executable, scalable models; enables automation and simulation | Complex enterprise processes needing automation and integration | Standards-based; bridges business and technical teams; supports execution |
Data Flow Diagram (DFD) | Medium | Systems analysts | Clear depiction of data flows, stores, and system boundaries | System design, data requirements analysis, IT implementation | Emphasizes data interactions; useful for compliance and system design |
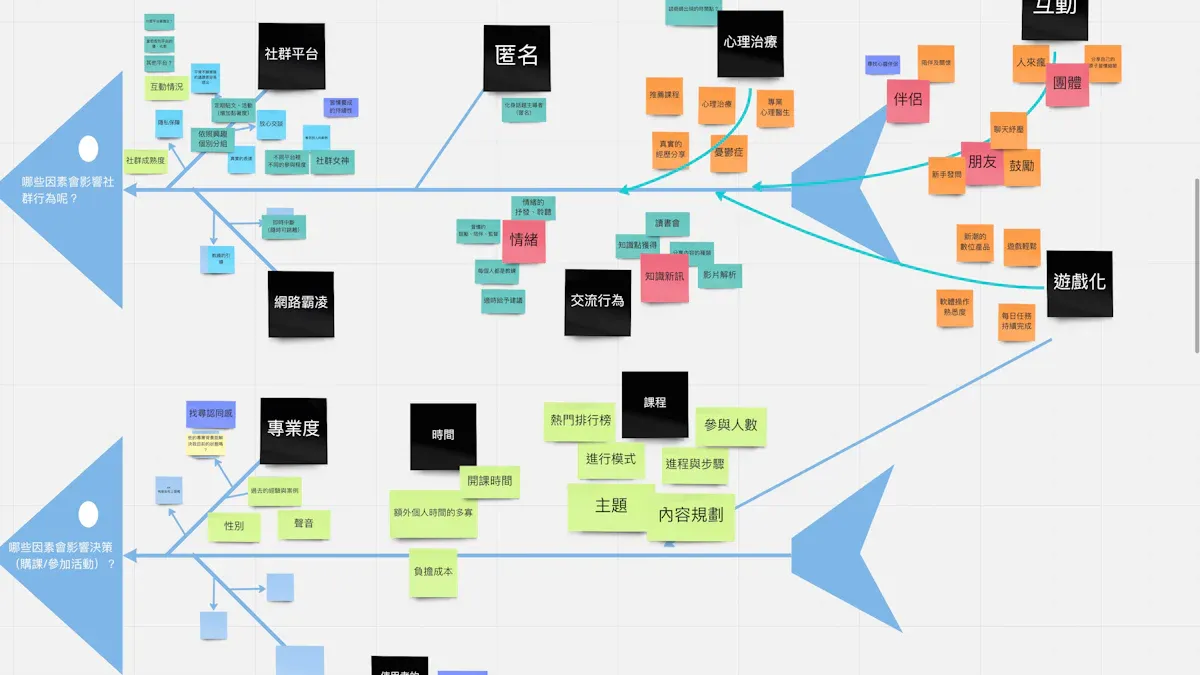
Fishbone Diagram (Ishikawa) | Low | Facilitated team workshops | Structured list of potential causes to investigate | Root cause analysis and quality problem-solving | Encourages broad brainstorming; easy to understand and apply |
Teams can also use other visual mapping methods, such as:
Swim lane diagrams: Show roles or departments involved in each process step.
Event-driven process chains: Highlight how events trigger tasks.
Business process models: Display structure and dependencies.
SIPOC diagrams: Categorize suppliers, inputs, process, outputs, and customers.
Value stream maps: Analyze the flow from production to customer delivery.
Mapping Tools
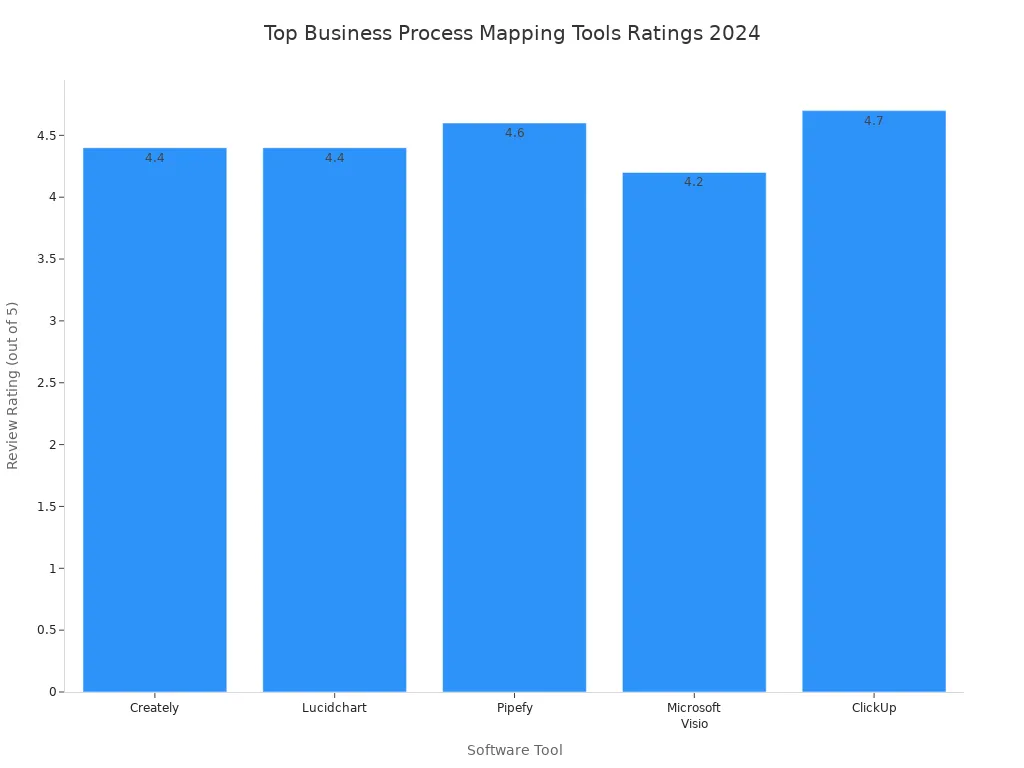
Modern software tools make process mapping easier and more collaborative. Many organizations use digital platforms to create, share, and update process maps in real time. The table below compares top tools for 2024:
Software Tool | Review Rating | Pricing | Key Features & Description |
|---|---|---|---|
Creately | 4.4 / 5 | Starter plan $5/month | Visual workspace, BPMN libraries, real-time collaboration |
Lucidchart | 4.4 / 5 | Free start; enterprise | Intelligent diagramming, cloud collaboration, integration with MS 365, Zoom, Slack |
Pipefy | 4.6 / 5 | Free basic; enterprise | Workflow automation, low/no-code BPM tools, AI-assisted process creation |
Microsoft Visio | 4.2 / 5 | From $5/user/month | Professional diagramming, templates, real-time collaboration, MS Office integration |
ClickUp | 4.7 / 5 | Free start; business $12 | Task/workflow management, whiteboards, drag-and-drop, extensive integrations |
Mapping Best Practices
Teams achieve the best results when they follow proven practices for process mapping. The following steps help ensure accuracy and usability:
Involve all relevant stakeholders to reflect actual workflows.
Keep the process map simple and focused for clarity.
Use consistent symbols and notation for better understanding.
Standardize the mapping workflow for repeatability.
Base maps on real workflow data, not assumptions.
Centralize documentation for easy access and updates.
Continuously review and improve process maps as workflows evolve.
Tip: Treat process maps as living documents. Regular updates help organizations adapt to changes and maintain efficiency.
Business Process Mapping techniques give teams the tools to visualize, analyze, and improve workflows. By selecting the right methods and tools, organizations can create clear, actionable maps that drive better performance.
Process Analysis
Process analysis helps organizations understand how their workflows perform and where improvements are needed. Teams use this step to examine each mapped process, looking for slowdowns, unnecessary steps, and areas that do not meet performance goals. By analyzing processes, organizations can make informed decisions that lead to better efficiency and higher quality.
Finding Bottlenecks
Bottlenecks slow down workflows and reduce productivity. Teams need to spot these problem areas to improve overall performance. Several effective methods help identify bottlenecks:
Employee feedback through structured surveys and interviews uncovers insights on operational slowdowns.
Technology-assisted detection uses AI-driven process mining tools to find and predict bottlenecks.
Continuous monitoring systems with real-time dashboards and alerts allow proactive identification.
Root cause analysis techniques, such as the "Five Whys," help teams understand why bottlenecks occur.
Process mapping and data analysis visualize and assess workflow performance.
Identifying Redundancies
Redundancies occur when teams perform the same task more than once or when multiple people handle the same responsibility. These extra steps waste time and resources. Teams can identify redundancies by:
Reviewing process maps for repeated activities.
Comparing current workflows with industry standards.
Asking employees about tasks that seem unnecessary or duplicated.
Tip: Removing redundant steps can free up resources and speed up the entire process.
Analyzing Inefficiencies
Inefficiencies appear as delays, errors, or wasted effort. Teams analyze inefficiencies by:
Observing where tasks take longer than expected.
Checking for frequent mistakes or rework.
Measuring how much time and cost each step requires.
A clear process map makes it easier to spot these issues and decide where to focus improvement efforts.
Performance Evaluation
Performance evaluation measures how well a process works. Teams use several metrics to assess performance and track progress over time. Common metrics include:
Process efficiency metrics to measure productivity.
Process variance metrics to show differences between actual and expected results.
Process effectiveness metrics to focus on quality and outcomes.
Process control metrics to monitor compliance.
Continuous improvement metrics to track benefits from changes.
Cycle time to measure how long a process takes from start to finish.
Defect rate to count errors or problems.
Customer satisfaction scores to gauge user experience.
Cost per unit to track expenses for each output.
Note: Regular performance evaluation helps teams set benchmarks and identify areas for ongoing improvement.
Business Process Mapping gives organizations the tools to analyze, measure, and optimize their workflows. By focusing on bottlenecks, redundancies, and performance metrics, teams can create more efficient and effective processes.
Process Redesign
Workflow Improvement
Streamlining Steps
Teams improve workflows by removing unnecessary steps and focusing on what adds value. They often use proven strategies to guide these changes. The table below shows some of the most impactful methods for workflow improvement:
Strategy | Description |
|---|---|
Agile | Encourages teamwork, flexibility, and quick adjustments in workflows. |
Business Process Improvement | Finds and fixes inefficiencies to make processes error-free. |
Business Process Reengineering | Redesigns workflows from the ground up using analysis and customer feedback. |
Lean Strategies | Reduces waste and focuses on activities that add value for customers. |
Six Sigma | Uses data to find and remove the causes of errors, improving process quality. |
Theory of Constraints | Identifies and improves the biggest barriers to achieving goals. |
Total Quality Management | Continuously looks for ways to reduce mistakes and improve the customer experience. |
Teams select the best strategy based on their goals and the type of process they want to improve. They may combine several methods to get the best results.
Leveraging Automation
Automation plays a key role in process redesign. It helps organizations remove manual tasks, which reduces errors and speeds up work. Teams can then focus on more complex and valuable activities. Automation also improves productivity and lowers costs.
Automation removes repetitive tasks, making processes faster and more accurate.
Organizations can use their resources for tasks that require problem-solving or creativity.
Many companies see a return on investment within a year after starting automation.
Employees spend much less time on routine work, which increases overall productivity.
Tip: Start by automating simple, repetitive steps. This approach builds confidence and shows quick results.
Redesign Examples
Many organizations have used Business Process Mapping and redesign to achieve impressive results. The table below highlights real-world examples:
Organization Type | Challenge Description | Methodology Applied | Results Description |
|---|---|---|---|
Global FMCG Company | Manual finance tasks and local workarounds | Eliminate, Standardize, Optimize, Automate, Robotize | 44% less effort in finance, better process visibility |
Major Manufacturing Client | Inefficient SAP processes across regions | Eliminate, Standardize, Optimize, Automate, Robotize | 25–50% better payment efficiency, higher satisfaction |
Government Agency | Long approval times for business licenses | Eliminate, Standardize, Optimize, Automate, Robotize | Processing time cut from 20 to 5 days, 40% less staff workload |
These examples show how process redesign can reduce effort, improve speed, and increase satisfaction. Teams that use a structured approach can see clear benefits in both private and public organizations.
Note: Regular review and redesign of workflows help organizations stay competitive and meet changing needs.
Implementation & Optimization
Change Management
Change management ensures that new processes become part of daily operations. Teams follow a structured approach to guide successful implementation. The key steps include:
Diagnose and set clear objectives. Teams analyze the current state and identify gaps.
Stakeholder analysis. They determine who will be affected and understand their perspectives.
Communication plan. Teams develop strategies to share information and updates.
Training and support. They provide resources to help individuals adjust to new workflows.
Monitoring and evaluation. Teams track the impact of changes and measure success.
Sustaining change. They embed new behaviors into the organizational culture.
Training and Communication
Training prepares employees for new processes. Teams use workshops, manuals, and hands-on sessions to build skills. Communication keeps everyone informed. Leaders share updates and explain the reasons for change. This approach reduces resistance and builds trust. Employees feel more confident when they understand the new workflow.
Effective training and clear communication help employees adapt quickly and minimize errors.
Adoption Strategies
Adoption strategies focus on engaging employees and securing leadership support. Teams involve staff in decision-making and highlight quick wins. Leaders demonstrate commitment by providing resources and championing the initiative. Common challenges include resistance to change, lack of leadership support, and insufficient employee engagement. Teams overcome these by fostering involvement, offering training, and maintaining open communication.
Resistance to change decreases when employees participate in planning.
Leadership support ensures resources and guidance.
Employee engagement grows with inclusive decision-making.
Clients at systems and teams have achieved workflow improvements by using Business Process Mapping. They identified inefficiencies, streamlined operations, and enhanced collaboration. This approach led to faster adoption and better results.
Monitor and Refine
Monitoring and refining processes keep workflows efficient and aligned with business goals. Teams track metrics and use feedback to optimize operations.
Tracking Metrics
Teams measure performance using key indicators:
Error rate shows the percentage of tasks with mistakes.
Customer satisfaction score reflects how well processes meet client needs.
Employee productivity rate tracks output over time.
Cost per transaction monitors expenses for each activity.
Teams gather data and compare results against initial process maps. They prioritize processes for automation based on metrics promising the highest return on investment.
Continuous Improvement
Continuous improvement relies on regular reviews and structured methodologies. Teams use Lean, Six Sigma, or Agile to analyze and enhance workflows. They focus on one process at a time and value progress over perfection. Collaboration and ownership drive accountability. Business process management software supports ongoing optimization.
Benefit | Description |
|---|---|
Fewer mistakes improve quality. | |
Increased customer satisfaction | Refined processes meet client needs better. |
Lower costs due to reduced waste | Streamlined operations save money. |
Enhanced brand reputation | Consistent quality boosts market standing. |
Fostering a culture of improvement | Employee involvement sustains enhancements. |
Teams build a culture of continuous improvement. They adapt processes to changing needs and maintain high performance.
Business Process Mapping follows clear steps:
Identify the process to improve.
List and organize each step.
Define sub-processes and decisions.
Involve the team and assign ownership.
Choose the map format.
Test and refine continuously.
These steps simplify workflows, break down silos, and clarify roles. A structured, lifecycle-based approach ensures lasting efficiency gains. Organizations that foster a culture of improvement, engage employees, and provide support see better results.
Ready to boost your workflow? Start mapping your processes today. For guidance or tools, feel free to reach out to us. Continuous improvement drives success. 🚀
Motivational Strategy | Description |
|---|---|
Encourage employees to find and apply improvements. | |
Encouraging employee engagement | Involve staff to build ownership and commitment. |
Providing resources and support | Offer tools, training, and leadership backing. |
FAQ
What is business process mapping?
Business process mapping shows each step in a workflow. Teams use it to visualize tasks, decisions, and outcomes. This method helps organizations find problems and improve efficiency.
Why should a company use process mapping?
Process mapping helps companies spot bottlenecks, reduce errors, and improve communication. Teams can use maps to make workflows faster and more reliable.
Which tools work best for process mapping?
Popular tools include Lucidchart, Microsoft Visio, and ClickUp. These platforms offer templates, collaboration features, and easy sharing. Teams choose tools based on their needs and budget.
How often should teams update process maps?
Teams should review process maps at least once a year or after major changes. Regular updates keep workflows accurate and aligned with business goals.
Who should participate in process mapping?
Key stakeholders include managers, employees, and sometimes customers. Involving different roles ensures the map reflects real tasks and challenges.
Can process mapping help with automation?
Yes. Process mapping highlights repetitive tasks. Teams use this information to identify steps that can be automated, saving time and reducing manual work.
What are common mistakes in process mapping?
Common mistakes include missing steps, unclear boundaries, and not involving enough stakeholders. Teams should use clear symbols and update maps regularly.
How does process mapping support continuous improvement?
Process mapping gives teams a clear view of workflows. They use maps to track changes, measure results, and find new ways to improve processes.


