How to Improve Workflows with Lean Six Sigma Process Mapping
Lean Six Sigma Process Mapping helps organizations streamline workflows and improve daily operations. Many professionals and managers report significant advantages, such as:
Waste reduction
Reduced costs
Data-driven decisions
Employee engagement
Increased revenue
These benefits lead to predictable cycle times and consistent quality for both clients and customers. Real-time data helps teams make immediate decisions, boosting morale and creating a responsive work environment. As readers explore Optimization Steps, they should consider how these strategies might enhance their own processes.
Key Takeaways
Lean Six Sigma Process Mapping helps organizations improve workflows and reduce waste.
Identifying bottlenecks and waste leads to faster processes and lower costs.
Clear communication through process mapping enhances teamwork and project planning.
Standardizing processes ensures consistent quality and reduces errors.
Using visual tools like flowcharts and swimlane maps clarifies roles and responsibilities.
Regularly updating process maps keeps them relevant and effective.
Engaging stakeholders throughout the process fosters support and better outcomes.
Monitoring results after changes helps teams sustain improvements and refine workflows.
Workflow Improvement with Process Mapping
Bottlenecks and Waste
Lean Six Sigma Process Mapping gives organizations a clear view of how work moves through each step. Teams often discover bottlenecks and waste that slow down progress or add unnecessary costs. Common types of waste identified include:
Motion: Unnecessary movement of people or materials.
Waiting: Idle time for employees or machines.
Overproduction: Making more than needed, which leads to excess inventory.
Overprocessing: Doing more work than the customer requires.
Defects: Products or services that do not meet standards and need rework.
Skills: Not using employees’ talents and skills fully.
By mapping out processes, teams can see where breakdowns occur. This approach helps them streamline steps and remove barriers, making operations more efficient. For example, a manufacturing team used Lean Six Sigma Process Mapping to spot repeated waiting times between production stages. They adjusted their workflow, which reduced delays and improved output.
Communication and Clarity
Process mapping also improves communication and clarity within organizations. When teams create visual maps of their workflows, everyone can see each step and understand their roles. This transparency helps with project planning and clarifies responsibilities. Teams can quickly spot roadblocks and inefficiencies, which leads to better outcomes.
Standardized processes, such as company-wide SOPs, prevent errors and improve clarity for both employees and customers.
Mapping the lifecycle of tasks, like customer contracts to billing, addresses disconnects and delays. This enhances communication between departments.
Actionable roadmaps and performance scorecards align stakeholders on priorities and responsibilities, which fosters better collaboration.
A service team, for instance, used process mapping to clarify handoffs between sales and billing. This reduced miscommunication and sped up the invoicing process.
Consistency and Standardization
Consistency and standardization are key benefits of Lean Six Sigma Process Mapping. Detailed process maps ensure that every task is performed the same way each time. This supports training, quality control, and adherence to standards.
Standardizing processes increases accuracy, efficiency, and accountability. This is especially important in regulated industries.
Consistency across teams leads to predictable outcomes and higher service quality.
Without standardization, teams may develop their own methods, causing errors, redundancies, and delays.
Organizations that use process mapping at both the systems and team levels often see fewer errors and improved service quality. For example, a healthcare team mapped out patient intake procedures. This ensured every staff member followed the same steps, which improved patient satisfaction and reduced mistakes.
Lean Six Sigma Process Mapping helps organizations at all levels identify waste, improve communication, and achieve consistent results. These improvements lead to better workflows and stronger business outcomes.
Lean Six Sigma Process Mapping
What Is Process Mapping
Process mapping is a visual tool that outlines the steps, inputs, and outputs of a process. It creates a clear, step-by-step picture of how work flows from start to finish. Teams use process mapping to see each task within a function and to understand how different departments interact. At its core, process mapping shows how inputs transform into outputs. This tool acts as a blueprint for the sequence of activities, details the flow of materials or information, and illustrates the relationships between process steps.
Process mapping serves as a blueprint for the sequence of activities.
It details the flow of materials or information.
It illustrates the relationships between different process steps.
Lean Six Sigma Process Mapping uses these visual tools to help everyone understand the process. When teams see the process laid out, they can spot problems, gaps, or extra steps that slow things down. This shared understanding makes it easier to improve workflows and reach business goals.
Why It Works
Process mapping works because it makes complex processes easy to see and understand. When teams map out a process, they can find steps that cause delays, errors, or waste. Lean Six Sigma Process Mapping combines two powerful ideas: Lean, which focuses on reducing waste, and Six Sigma, which aims to prevent defects. Together, they help teams create processes that are both efficient and high-quality.
Process mapping acts as a roadmap for business processes. It guides teams to simplify steps, remove waste, and improve quality.
Empirical data shows that process mapping leads to real improvements:
Metric | Improvement |
|---|---|
Dimension Variation | |
Late Deliveries | Slashed by 45% |
Test Precision | Improved 7-fold |
Erroneous Result Rates | Cut from 1.2% to under 0.4% |
Yield | Increased by $125K annually |
On-time Delivery | Boosted by 11% |
Monthly Volume Shipped | Increased by 5.2% |
Cost Savings | Achieved 9% by reducing rework |
Line Failures | Cut by 44%, saving $3.1M annually |
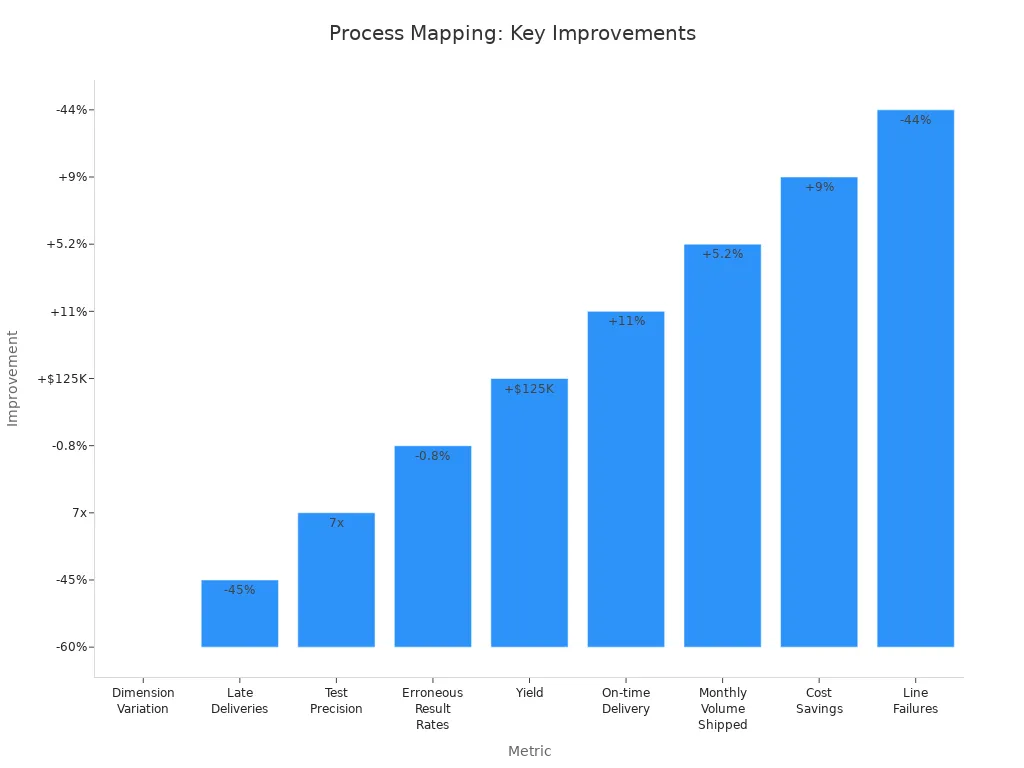
These results show that process mapping can reduce variation, cut costs, and improve delivery times. Teams see fewer errors and more reliable outcomes. Lean Six Sigma Process Mapping helps organizations reach higher levels of performance by making every step visible and open to improvement.
Common Myths
Many people have misconceptions about Lean Six Sigma Process Mapping. Some think it only works in factories or that it is too complex for most teams. Experts have addressed these myths:
Misconception | Reality |
|---|---|
It’s only for manufacturing. | LSS is applied in healthcare, finance, IT, services, education, and more. Any process can benefit from efficiency and quality improvement. |
It’s just about cutting costs. | LSS is about creating value—reducing waste, improving customer satisfaction, and building sustainable systems. |
It’s too complicated and statistical. | While data plays a role, LSS is also about simple tools, teamwork, and problem-solving methods anyone can learn. |
Only top management needs it. | Success comes when everyone—from frontline staff to leaders—embraces continuous improvement. |
It’s a “one-time project.” | Lean Six Sigma is a mindset and culture that drives ongoing improvement. |
Lean Six Sigma Process Mapping is not limited to one industry or job level. It helps any team that wants to improve how work gets done. The approach is practical, team-based, and focused on long-term results.
Types of Process Maps
SIPOC Diagram
A SIPOC diagram gives teams a high-level view of a process. SIPOC stands for Suppliers, Inputs, Process, Outputs, and Customers. This map helps teams see the big picture before diving into details. Teams use SIPOC diagrams to define the boundaries of a process and to align on project goals.
SIPOC diagrams provide a clear overview of the process, its main components, and how they connect.
Teams use SIPOC to clarify project scope and make sure everyone understands customer requirements.
When the project scope is unclear, SIPOC diagrams increase transparency and help team members visualize the entire process.
A complete SIPOC creates a shared understanding among team members about the process and its variables.
Tip: Use a SIPOC diagram at the start of a project to set clear boundaries and expectations.
Value Stream Map
A Value Stream Map (VSM) shows every step in a process, from start to finish. This map helps organizations see which steps add value and which do not. Teams use VSM to find waste and improve efficiency.
Process mapping with a VSM lets organizations analyze each step and sort it into three categories: value-added, necessary non-value-added, or pure waste. Value-adding activities change a product or service in a way that customers want. Non-value-adding activities do not help the customer and often signal waste. By separating these steps, teams can focus on removing waste and improving flow.
Improved customer service by making sure every step adds value for the customer.
Increased efficiency by removing tasks that do not add value.
Better decision-making because teams gain clear insights into their processes.
Value Stream Maps help teams see where time, effort, or resources are wasted, making it easier to streamline workflows.
Swimlane Map
A Swimlane Map organizes process steps into lanes, each representing a person, team, or department. This map clarifies who does what at each stage. Swimlane maps prevent confusion by showing the flow of tasks and interactions between roles.
Feature | Benefit |
|---|---|
Prevents confusion and clarifies contributions | |
Consistent labeling | Makes it easy to understand roles and processes |
Logical flow | Helps viewers see relationships between tasks and lanes |
Lanes distribute accountability | Clarifies who is responsible for each part of the process |
Defining roles in each swimlane helps everyone understand their part in the process.
Consistent labels make the map easy to read.
A logical sequence of steps helps teams see how tasks move between people or departments.
Lanes show accountability, so everyone knows who is responsible for each step.
Swimlane maps are especially useful for processes that involve multiple teams or departments. They make handoffs and responsibilities clear.
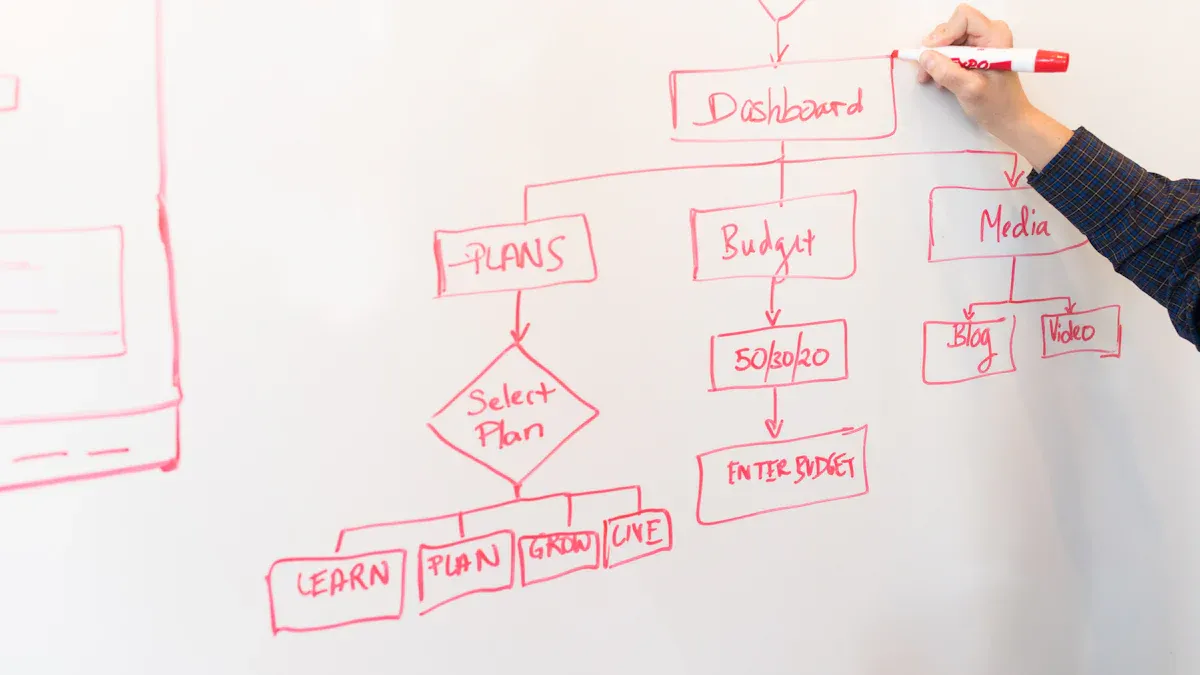
Process Flowchart
A process flowchart gives teams a clear visual guide to how work moves from one step to the next. This tool uses simple symbols, lines, and arrows to show each action and decision in a workflow. Teams often choose process flowcharts because they make complex tasks easier to understand and analyze.
The main elements of a process flowchart include:
Symbols: Each symbol stands for a specific type of step. For example, rectangles show tasks or activities, diamonds represent decisions, and ovals mark the start or end of a process.
Connecting Lines: Lines link the symbols together, showing how each step leads to the next.
Directional Arrows: Arrows point the way, making the order of actions clear.
These components work together to create a visual map of the workflow. Teams use this map to spot problems, find delays, and improve how work gets done. A process flowchart helps everyone see the big picture and understand their role in the process.
Tip: Use standard symbols and clear labels to make your flowchart easy for everyone to read.
Process flowcharts support process analysis in several ways. They help teams identify steps that do not add value or cause confusion. By following the arrows and lines, team members can trace the flow of work and see where bottlenecks or errors might happen. This makes it easier to fix problems and streamline tasks.
A process flowchart also improves communication. When everyone sees the same visual map, misunderstandings decrease. Team members can discuss each step and agree on changes. This shared understanding leads to better teamwork and faster improvements.
Symbol | Meaning | Example Use |
|---|---|---|
Rectangle | Task/Activity | "Review Application" |
Diamond | Decision Point | "Is Form Complete?" |
Oval | Start/End | "Begin Process" |
Arrow | Flow Direction | Shows next step |
Teams in many industries use process flowcharts. In healthcare, staff map patient check-in steps to reduce wait times. In finance, analysts chart approval processes to avoid delays. In manufacturing, workers outline assembly steps to prevent mistakes.
Process flowcharts offer flexibility. Teams can create simple charts for basic tasks or detailed maps for complex projects. Digital tools make it easy to update and share flowcharts with others.
A well-designed process flowchart helps teams see every step, understand the flow, and make smart changes. This tool supports Lean Six Sigma goals by making processes visible and open to improvement.
Process Mapping Steps
Define Objectives
Every successful Lean Six Sigma Process Mapping project begins with clear objectives. Teams must know what they want to achieve before they start mapping. Setting objectives helps everyone stay focused and ensures the process map delivers value.
Determine the context and scope. Teams should ask, "What process needs improvement?" and "Where does this process begin and end?"
Identify the desired outcome. Teams must decide what they want to accomplish with the process map. This could include reducing errors, speeding up delivery, or improving customer satisfaction.
Decide which process or part of a process to review. Teams should select the area that will have the most impact or where problems often occur.
Setting clear objectives gives the team direction and helps measure success later.
Build the Team
A strong team forms the foundation of effective process mapping. Each member brings unique knowledge and skills. Teams should include people who work directly with the process and those who understand the bigger picture.
Select team members from different roles. This ensures a variety of perspectives.
Include subject matter experts. They know the details of the process.
Add a facilitator or Lean Six Sigma expert. This person guides the mapping session and keeps the group on track.
Encourage open communication. Every member should feel comfortable sharing ideas and concerns.
Diverse teams spot more issues and create better solutions.
Map Current State
Mapping the current state means documenting how the process works today. Teams must capture every step, decision, and handoff. This map becomes the baseline for all improvements.
Description | |
|---|---|
Visualize the whole process | Documenting every step provides a high-level overview, essential for process improvement. |
Identify defects, redundancy and waste | A process map helps pinpoint inefficiencies, saving time and effort in the long run. |
Streamline ops and improve processes | A detailed process map highlights issues, facilitating easier improvements. |
Facilitate collaboration | Process maps serve as communication tools, fostering a common understanding among team members. |
Follow the DMAIC methodology | This structured approach guides process improvements through defined steps: Define, Measure, Analyze, Improve, Control. |
Use various types of process maps | Different maps (SIPOC, High Level, Detailed, Swimlane, Value Stream) reveal unique insights into the process. |
Before mapping, teams should:
Clearly communicate the goal of the mapping exercise.
Pre-plan any data collection efforts.
Ensure a diverse mix of team members.
Perform a Gemba walk to observe the process in action.
Gather materials for mapping, such as sticky notes, markers, or digital tools.
Mapping the current state helps teams see the real process, not just how they think it works. This step uncovers hidden problems and sets the stage for improvement.
Analyze for Inefficiency
Teams use process maps to uncover where workflows break down or slow down. After mapping the current state, they must analyze the process to find steps that waste time, money, or resources. This analysis helps teams focus on what needs improvement.
Several analytical methods help teams identify inefficiencies:
Analytical Method | Purpose |
|---|---|
Value Analysis | Distinguish between value-adding and non-value-adding tasks to eliminate unnecessary steps. |
Root Cause Analysis | Identify the root causes of inefficiencies using techniques like the '5 Whys' or fishbone diagrams. |
Time Analysis | Measure processing, waiting, and cycle times to uncover delays. |
Cost Analysis | Analyze direct and indirect costs to find savings opportunities. |
Efficiency Analysis | Evaluate key performance indicators (KPIs) to assess resource utilization effectiveness. |
Teams often start with value analysis. They look at each step and ask if it adds value for the customer. Steps that do not add value become candidates for removal or redesign. Root cause analysis helps teams dig deeper into problems. For example, using the "5 Whys" technique, they ask "Why?" repeatedly until they find the real reason for a delay or error.
Time analysis measures how long each step takes. Teams can spot bottlenecks by comparing processing times and waiting periods. Cost analysis looks at both direct and indirect expenses. This helps teams find areas where they can save money. Efficiency analysis uses key performance indicators to measure how well resources are used.
Teams that use these methods gain a clear picture of where their process breaks down. This step sets the stage for meaningful improvements.
Design Future State
Once teams understand where inefficiencies exist, they can design a better process. The goal is to create a future state map that removes waste, reduces errors, and improves flow.
A structured approach helps teams design an effective future state:
Analyze the current process to understand inefficiencies.
Define clear goals and metrics for the new process.
Collaborate with stakeholders to ideate improvements.
Design the future workflow using structured visual tools.
Validate the design with stakeholders to ensure feasibility.
Plan for implementation and change management to ensure successful execution.
Teams begin by reviewing the current process and identifying what needs to change. They set specific goals, such as reducing cycle time or increasing accuracy. Collaboration with stakeholders brings in new ideas and ensures that changes will work in practice. Teams use visual tools, like updated process maps or flowcharts, to design the new workflow.
Validation is important. Teams share the future state map with stakeholders to check if the design is practical and meets business needs. Planning for implementation includes preparing for change management. This helps everyone adjust to the new way of working.
A well-designed future state map guides teams toward their goals and makes improvements sustainable.
Communicate Changes
Clear communication ensures that everyone understands and supports the new process. Teams must share changes with all stakeholders to build buy-in and reduce confusion.
Successful communication techniques include:
Face-to-face meetings for direct interaction.
Written notifications like emails for clear updates.
Interactive workshops to facilitate discussions.
Online collaboration tools for real-time information sharing.
Teams also benefit from a comprehensive stakeholder engagement plan. They identify and categorize stakeholders based on their influence and interest. Engagement strategies may include one-on-one meetings, group workshops, or regular updates. Teams establish feedback mechanisms so stakeholders can share their thoughts and concerns.
Regular communication, clear messaging, and open feedback help teams manage change smoothly. Using multiple channels, such as meetings and emails, ensures that everyone stays informed and involved.
By analyzing inefficiencies, designing a future state, and communicating changes, teams can transform their workflows. These steps help organizations achieve lasting improvements and reach their business goals.
Analyzing and Improving Workflows

Root Cause Analysis
Root cause analysis (RCA) plays a central role in Lean Six Sigma process mapping. Teams use RCA to identify the real reasons behind workflow problems. This method uncovers issues that cause delays, errors, or waste. RCA focuses on finding the source of a problem, not just treating its symptoms. Teams often use tools like the "5 Whys" or fishbone diagrams to dig deeper into issues.
RCA helps teams find underlying causes of inefficiencies.
It supports effective problem-solving by targeting root causes.
RCA forms a key part of the "Analyze" phase in the DMAIC framework.
Teams use RCA to promote continuous improvement and prevent problems from returning.
By addressing the root causes, organizations can create lasting solutions. This approach leads to better performance and fewer recurring issues.
Prioritizing Improvements
After identifying problems, teams must decide which improvements to tackle first. Not every issue has the same impact. Teams use clear criteria to rank opportunities and focus on changes that deliver the most value.
Criteria | Description |
|---|---|
Alignment with strategy | Supports organizational goals and objectives. |
Customer needs | Enhances customer satisfaction and meets requirements. |
Stakeholder expectations | Considers the needs of everyone involved. |
Impact on satisfaction, revenue | Focuses on areas that affect satisfaction, revenue, or compliance. |
Cost, errors, waste reduction | Targets cost savings, error reduction, and waste elimination. |
SMART goals | Ensures goals are Specific, Measurable, Achievable, Relevant, and Time-bound. |
Importance, urgency, feasibility | Ranks by significance, immediacy, and practicality. |
Resources, time, risks | Evaluates available resources, time limits, and risks. |
Teams often start by mapping the current state to visualize workflows and spot inefficiencies. They then analyze the map to uncover problems and prioritize improvements. Designing a future state map creates a blueprint for the improved process. Engaging stakeholders throughout this process brings in diverse perspectives and helps identify the most pressing issues.
Monitoring Results
Once teams implement changes, they must track results to ensure improvements work as intended. Monitoring uses specific metrics to measure progress and highlight areas for further refinement.
Metric | Description |
|---|---|
User engagement | Measures how actively users interact with the process. |
Drop-off rates | Shows where users abandon the process. |
Satisfaction scores | Reflects user satisfaction. |
Task completion rates | Tracks successful task completion. |
Time to completion | Measures total process time. |
Hand-off efficiency | Assesses transitions between tasks. |
Time-to-completion for each step | Evaluates duration for each step. |
Error rates | Monitors frequency of errors. |
Cost per process | Calculates financial cost. |
Overall process efficiency | Evaluates process effectiveness. |
Teams review these metrics regularly. They look for trends, such as improved task completion rates or reduced error rates. This data-driven approach helps teams sustain gains and continue refining workflows. By monitoring results, organizations ensure that improvements deliver real, measurable benefits.
Tips for Success
Stakeholder Engagement
Successful process mapping depends on strong stakeholder engagement. Teams should keep everyone informed and involved from the start. Regular updates help stakeholders stay aware of progress and changes. Teams can set up feedback channels so stakeholders can share their ideas and concerns. This approach ensures the process map reflects real needs and priorities.
Strategy | Description |
|---|---|
Regular Updates | Teams provide ongoing information to keep stakeholders engaged. |
Feedback Integration | Teams use stakeholder input to improve the mapping process. |
Alignment with Business Processes | Teams connect mapping activities to larger business goals. |
Teams also benefit from clear communication schedules and specific engagement activities. Setting up feedback mechanisms and measurement criteria helps track involvement and satisfaction. When stakeholders feel heard, they support changes and help drive improvement.
Teams that involve stakeholders early and often build trust and achieve better results.
Avoiding Pitfalls
Lean Six Sigma process mapping projects can face common pitfalls. Teams should watch for these issues and take steps to avoid them.
Pitfall | Explanation |
|---|---|
Teams may not measure improvements, leading to unclear results. | |
Limited Process Ownership | If only one team owns the process, improvements may not last or spread across the organization. |
Confusing Visuals With Value | Teams might focus on making maps look good instead of showing real value or waste reduction. |
To avoid these problems, teams should:
Assign process ownership across departments.
Use metrics to measure and validate improvements.
Focus on customer value, not just visual appeal.
Teams should also check their work and ensure that every step in the process map adds value. Reviewing the map with fresh eyes helps catch mistakes and keeps the project on track.
Using Tools
Digital tools make process mapping easier and more effective. Teams can choose from several popular options, each with unique features:
Microsoft Visio: Offers many shapes, works well with Microsoft Office, and allows customization.
Lucidchart: Provides a simple drag-and-drop interface, real-time collaboration, and Google Workspace integration.
draw.io: Free to use, supports cloud storage, and offers many export options.
IBM Blueworks Live: Supports BPMN notation, advanced analysis, and team collaboration.
Bizagi Modeler: User-friendly, supports BPMN, and integrates with other Bizagi products.
These tools help teams create clear, accurate process maps. Features like real-time collaboration and cloud storage make it easy to work together, even from different locations. Teams should select the tool that fits their needs and ensures everyone can access and update the process map.
Choosing the right tool supports teamwork and helps maintain accurate, up-to-date process maps.
By engaging stakeholders, avoiding common pitfalls, and using the right tools, teams can achieve lasting success with Lean Six Sigma process mapping.
Benefits
Productivity Gains
Lean Six Sigma process mapping helps organizations achieve noticeable productivity gains. Teams and systems both benefit from clearer workflows and better resource use. When teams map their processes, they can see each step and remove unnecessary actions. This leads to faster results and smoother operations.
Healthcare organizations have used Lean Six Sigma to improve care quality and reduce costs.
Teams track progress with metrics like defect rates and production throughput.
The DMAIC framework guides teams to measure and improve each process step.
Hospitals have reduced surgical complications and shortened patient stays by applying Lean Six Sigma methods.
These improvements show that process mapping does not just help one department. It supports entire systems by making work more efficient and organized.
Fewer Errors
Process mapping reduces errors by making every step clear and easy to follow. Teams can spot where mistakes happen and fix them before they grow into bigger problems. When everyone understands the process, fewer things go wrong.
The following table highlights real-world examples of error reduction:
Case Study | Error Reduction | Customer Satisfaction Improvement |
|---|---|---|
Xerox | Significant reduction in variance and waste | Improved service performance and customer satisfaction |
Anne Cesarone's Green Belt Project | Increased customer happiness | |
Boutique Clothing Store | Reduced stockouts | Improved customer satisfaction and increased sales |
At both the team and system level, these results show that Lean Six Sigma process mapping leads to fewer mistakes. Teams can deliver higher quality work, and organizations see fewer costly errors.
Customer Satisfaction
Customer satisfaction rises when organizations use Lean Six Sigma process mapping. Clearer processes mean customers get what they need faster and with fewer problems. Teams can respond to customer requests more quickly and accurately.
When errors drop and productivity rises, customers notice the difference. For example, Xerox improved service performance, which led to happier clients. A boutique clothing store reduced stockouts, so customers found what they wanted more often. Anne Cesarone’s project saw a direct link between fewer errors and happier customers.
Teams that use Lean Six Sigma process mapping build trust with their customers. Reliable service and consistent quality keep customers coming back.
Lean Six Sigma process mapping helps both systems and teams deliver better results. Productivity increases, errors decrease, and customer satisfaction grows. These benefits make process mapping a valuable tool for any organization.
Lean Six Sigma Process Mapping gives organizations a clear path to better workflows, fewer errors, and higher customer satisfaction. Teams can use these steps to spot problems and make real improvements. Next, they should involve their teams or seek more training to build skills. For those who want to learn more, reaching out can help systems and teams achieve similar results.
FAQ
What is the main goal of Lean Six Sigma process mapping?
Lean Six Sigma process mapping aims to make workflows clear and efficient. Teams use it to find waste, reduce errors, and improve quality. This method helps organizations deliver better results for customers.
Who should participate in process mapping sessions?
Teams should include people who work directly with the process and those who understand the bigger picture. Subject matter experts and a facilitator help guide the session and ensure accuracy.
How often should teams update their process maps?
Teams should review process maps after major changes or at least once a year. Regular updates keep maps accurate and help teams spot new problems or opportunities for improvement.
Can process mapping help remote or hybrid teams?
Yes. Process mapping supports remote and hybrid teams by making workflows visible. Digital tools allow team members to collaborate, share updates, and keep everyone aligned, no matter where they work.
What tools work best for creating process maps?
Popular tools include Microsoft Visio, Lucidchart, draw.io, and IBM Blueworks Live. These tools offer templates, collaboration features, and easy sharing. Teams should choose a tool that fits their needs and budget.
Does Lean Six Sigma process mapping work outside manufacturing?
Absolutely. Lean Six Sigma process mapping improves workflows in healthcare, finance, education, and service industries. Any team that wants to reduce waste and improve quality can use this method.
How does process mapping support training and onboarding?
Process maps give new team members a clear visual guide. They show each step and responsibility, making it easier for new hires to learn tasks and follow best practices.
What is the difference between a process flowchart and a swimlane map?
A process flowchart shows the sequence of steps in a workflow. A swimlane map adds lanes for each person or team, making roles and handoffs clear. Both help teams understand and improve processes.


