3 simple Business Process Mapping steps for success

Business Process Mapping follows three simple steps: choose a process, visualize the workflow, and analyze for improvement. This approach defines what tasks occur, assigns responsibility, sets clear standards, and measures success. Many organizations report impressive results after applying these optimization steps.
Source | Percentage of Organizations Reporting Improved Efficiency |
|---|---|
Gartner | 80% of organizations conducting BPM projects will experience an internal rate of return better than 15%. |
Forrester | BPM typically delivers 30-50% productivity gains. |
Clients and customers benefit from clearer directions, increased control, and lower costs. Process mapping leads to better understanding, improved efficiency, and stronger communication. Anyone can start today—simplicity drives success.
Key Takeaways
Business Process Mapping involves three steps: choose a process, visualize it, and analyze for improvement.
Selecting the right process to map is crucial. Focus on processes that need improvement or have high impact.
Clear objectives guide the mapping process. Define what you want to achieve before starting.
Setting boundaries helps keep the mapping project focused. Know where the process starts and ends.
Visualizing workflows with clear diagrams helps identify bottlenecks and improves communication.
Regular reviews of process maps ensure they stay relevant and effective. Schedule updates to catch inefficiencies.
Involve key stakeholders in the mapping process. Their input leads to more accurate and effective maps.
Using digital tools for mapping enhances collaboration and makes updates easier.
Business Process Mapping Basics
Business Process Mapping helps organizations understand, document, and improve their workflows. This section explains how to choose the right process, define clear objectives, and set boundaries for effective mapping.
Choose Process
Selecting the right process to map is the first step. Not every process needs mapping at once. Teams should focus on those that offer the most value or need improvement.
Selection Criteria
Organizations often use specific criteria to decide which process to map first. The table below outlines common factors:
Criteria | Description |
|---|---|
Potential for improvements | Assess processes for their capacity to deliver qualitative and quantitative improvements. |
Process maturity | Categorize processes based on their level of maturity, targeting the least mature for improvements. |
Identify processes that directly influence business outcomes, such as customer-facing processes. | |
Scoring model | Use a scoring model to assign scores based on business impact, frequency, risk, and alignment. |
Alignment with organizational goals | Ensure selected processes support strategic priorities and critical business outcomes. |
Tip: Teams can use a scoring model to objectively compare processes and select the one that aligns best with business goals.
Common Examples
Some processes appear frequently in mapping projects. These include:
Customer onboarding
Order fulfillment
Invoice processing
Employee recruitment
IT support ticket resolution
Teams often start with high-impact or customer-facing processes because improvements here can deliver quick wins.
Define Objectives
Clear objectives guide the mapping effort. Teams should know what they want to achieve before starting.
Success Metrics
Success metrics help measure the effectiveness of a mapped process. Organizations use different types of metrics, as shown below:
Metric Category | Examples |
|---|---|
Business Metrics | Customer satisfaction scores, Employee engagement and retention rates, Product quality and defect rates, Cycle times and lead times, Capacity utilization and throughput |
Financial Metrics | Revenue and profit margins, Operating expenses and overhead costs, Working capital and cash conversion cycle, Return on assets (ROA) and return on equity (ROE), Debt-to-equity ratio |
Technical Metrics | System availability and uptime, Response time and latency, Error rates and defect density, Capacity and scalability, Security and compliance |
Teams should select metrics that match their goals. For example, a team focused on customer service might track satisfaction scores and response times.
Align with Goals
Objectives must align with organizational goals. Teams should:
Define the purpose of mapping before starting.
Clarify what the business process aims to achieve.
Identify how the process supports company objectives.
Use mapping to spot steps that help or hinder progress.
Note: Aligning objectives with company goals ensures that process improvements support strategic priorities.
Set Boundaries
Setting boundaries keeps the mapping project focused and manageable. Teams need to know where the process starts and ends, what it includes, and who is involved.
Start/End Points
To set boundaries, teams should:
Identify the start and end points of the process.
Determine key inputs and expected outputs.
Set the scope by outlining what is included and excluded.
Establish constraints and document assumptions.
This approach prevents confusion and keeps the project on track.
Stakeholders
Stakeholders play a key role in Business Process Mapping. Teams should:
Identify all groups affected by the process, including employees, customers, and partners.
Recognize subgroups and ancillary stakeholders who may be impacted.
Use affinity mapping to cluster stakeholders with similar interests.
Prioritize stakeholders by assessing their impact and interest.
Engaging the right stakeholders ensures accurate mapping and smooth implementation of improvements.
Business Process Mapping succeeds when teams define objectives, select the right process, and set clear boundaries. These basics lay the foundation for visualizing and improving workflows.
Visualize the Process
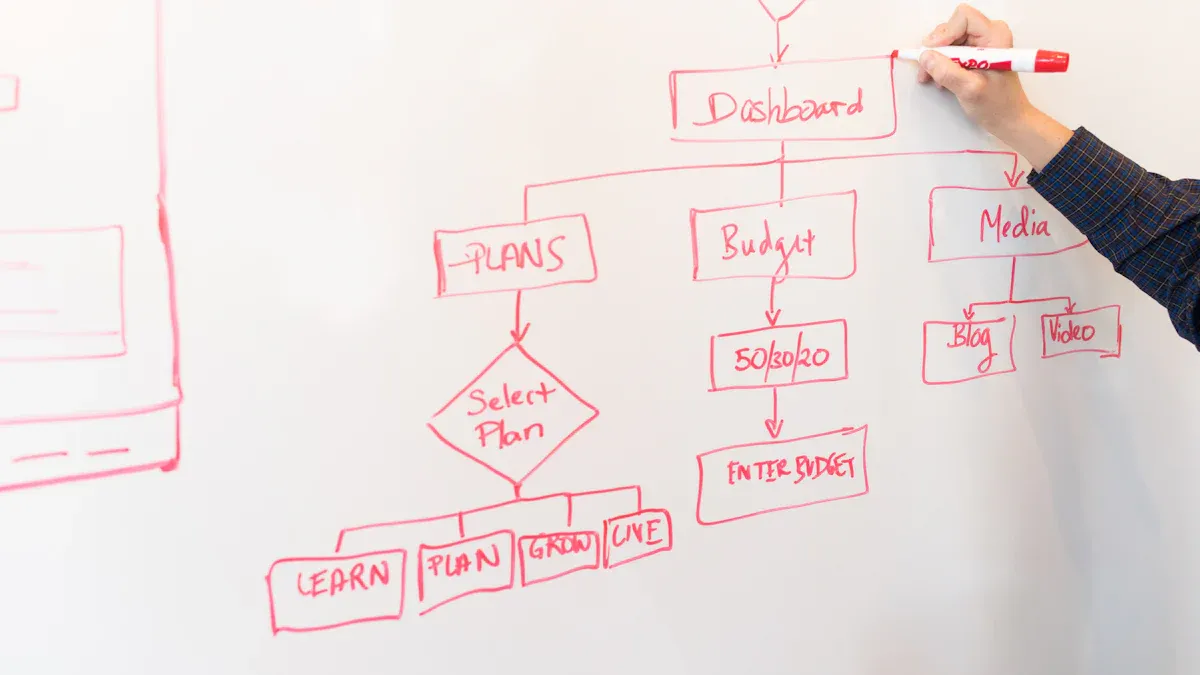
Visualizing workflows helps teams understand how tasks move from start to finish. Clear diagrams reveal decision points, highlight bottlenecks, and support better communication. This section explains how to use mapping tools, create flowcharts, and ensure clarity in every business process map.
Mapping Tools
Digital vs. Paper
Teams can choose between digital tools and paper-based methods for mapping processes. Digital tools offer several advantages:
Increased efficiency through faster data capture and editing.
Improved accuracy by reducing transcription errors.
Immediate access to updated maps after syncing, while paper-based updates may take days.
Paper-based methods can help with brainstorming or quick sketches, but digital tools support collaboration and long-term management.
Software Options
Many organizations use specialized software to create process maps. Popular options include:
Lucidchart
Creately
Microsoft Visio
IdeaBoard
Pipefy
ClickUp
These tools are easy to use, support team collaboration, and connect visualization to action. Some platforms also use AI to help document processes quickly. When selecting software, teams should look for features such as relational mapping, efficiency calculations, and integration with other business tools.
Feature | Description |
|---|---|
Relational mapping | Breaks down complex processes into manageable parts and connects them across multiple processes. |
Calculating process efficiency | Allows for direct calculation of process steps within the diagram, enhancing efficiency assessment. |
Integration capabilities | Connects with tools like Zapier and Hubspot to ensure workflows are synchronized and up-to-date. |
Create Flowcharts
Symbols & Notations
Standard symbols make flowcharts easy to read and understand. Common symbols include:
Symbol Type | Description |
|---|---|
Oval | Start or end of a process |
Rectangle | Task or action |
Diamond | Decision point |
D-shaped semicircle | Delay or waiting period |
Slanted rectangle | Data storage or retrieval |
Rectangle with wavy bottom | Document |
Rectangle with double vertical bars | Subroutine or reusable process |
Hexagon | Preparation or setup step |
Rectangle with curved top edge | Information displayed to the user |
Document, data input, and data output symbols show how information moves through the process.
Step-by-Step
Teams can follow these steps to create clear flowcharts:
Determine the purpose and scope of the flowchart.
Identify each step and its sequence.
Choose the correct symbols for each action or decision.
Draw the flowchart using a tool or on paper.
Test the flowchart and gather feedback for improvement.
Defining the purpose and scope helps teams focus on what matters. Testing with feedback ensures accuracy and clarity.
Ensure Clarity
Simplicity Tips
Teams should keep process maps simple and up to date. They can:
Regularly update maps to match current practices.
Limit the scope to avoid unnecessary complexity.
Standardize symbols and terms for consistency.
Use digital tools for flexibility and easy collaboration.
Avoid Overcomplication
Overcomplicated maps can confuse users and reduce productivity. Teams should avoid:
Adding too much detail or irrelevant information.
Creating cluttered diagrams that overwhelm viewers.
Using jargon that discourages open discussion.
Simple, clear maps help everyone understand the process and support better teamwork.
Analyze and Improve

Business Process Mapping does not end with visualization. Teams must review, analyze, and enhance their process maps to boost productivity and ensure continuous improvement.
Review Map
Stakeholder Input
Teams should involve process owners and key personnel in every review. Their participation ensures that documentation reflects current practices and any recent updates. Regular consultations with stakeholders validate assumptions and improve engagement. Ignoring stakeholder feedback often leads to misaligned strategies and missed collaboration opportunities. Involving stakeholders from the beginning fosters trust and ownership, resulting in quicker approvals and better outcomes.
Create mechanisms for stakeholder feedback.
Consult stakeholders regularly to validate mapping assumptions.
Encourage open discussion to enhance engagement.
Note: 53% of workers struggle to adapt to change when stakeholder input is missing. 70% of change initiatives fail due to insufficient cooperation from teams.
Feedback Methods
Teams use several methods to gather and incorporate feedback:
Virtual whiteboards facilitate communication during feedback sessions.
Mapping the process together helps team members understand their roles.
Separate strategic feedback from subjective opinions to keep discussions focused.
Asynchronous feedback methods, such as one-on-one discussions and visual collaboration apps, allow flexibility.
Synthesize and summarize feedback for actionable outcomes.
Be transparent about how feedback will be used.
Follow up with the team regarding changes to project goals or workflows.
Scheduled reviews, such as quarterly or annual sessions, keep documentation accurate and complete. Expert reviews and peer checks help catch misinterpretations or omissions.
Find Bottlenecks
Types of Issues
Teams identify bottlenecks by looking for:
Queue buildup, where tasks pile up quickly.
Elongated cycle times, when stages take longer than others.
Resource concentration, with multiple workflows depending on a single resource.
Handoff complexity, causing delays between teams or departments.
Other indicators include high work-in-progress levels and frequent errors or rework.
Analysis Tools
Teams use several tools to diagnose issues:
Tool Type | Description |
|---|---|
Creates clear documentation and supports real-time collaboration. | |
Analytics and monitoring platforms | Tracks process performance, highlighting cycle times and bottlenecks. |
Automation platforms | Combines analysis with automation for immediate workflow improvements. |
Process mining | Analyzes digital traces to reveal actual process performance. |
Value stream mapping, fishbone diagrams, and the 5 Whys method help teams find root causes and areas for improvement.
Apply Improvements
Prioritize Changes
Teams prioritize changes by evaluating potential impact and profitability against the difficulty or complexity of implementation. The PICK analysis method helps categorize initiatives based on these dimensions. This approach ensures that teams focus on changes that deliver the most value with manageable effort.
Monitor Results
Continuous monitoring tracks progress over time. Regular reviews confirm that changes yield desired results and allow teams to adjust for new challenges. Setting specific KPIs helps evaluate effectiveness and identify new opportunities for enhancement. Keeping stakeholders informed ensures valuable feedback and considers new variables that may affect long-term performance.
Tip: Process improvement is ongoing. Teams should review and refine their maps regularly to maintain efficiency and adapt to change.
Benefits of Business Process Mapping
Efficiency Gains
Organizations often see measurable improvements after mapping their processes. Teams at systems and clients using process mapping report faster production and fewer delays. The following table shows how efficiency increases in different areas:
Impact | Measurable Outcome |
|---|---|
Reduced production delays | 40% reduction in delays in supply chain |
Reduced order processing time | 30% reduction by automating confirmations |
Cut onboarding time | Reduced from 10 days to 5 days |
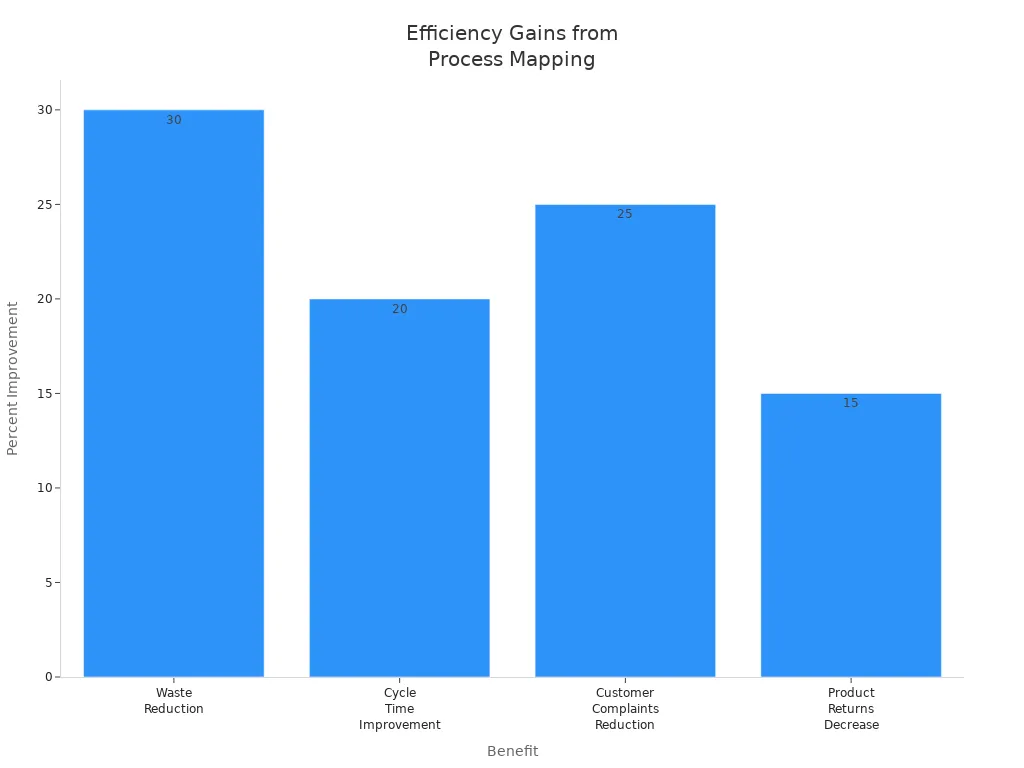
Clients also notice less waste and shorter cycle times. The next table highlights these results:
Benefit | Quantified Impact |
|---|---|
Waste Reduction | 30% reduction |
Cycle Time Improvement | 20% improvement |
Customer Complaints Reduction | 25% reduction |
Product Returns Decrease | 15% decrease |
Teams using Six Sigma process mapping often achieve defect reductions of 70-90%. Cycle times improve by 30-50%. These changes help systems and teams deliver products faster and save costs.
Better Communication
Business Process Mapping helps teams and systems work together. It removes barriers between departments and makes teamwork easier. Teams see how their work connects to others. This shared view improves understanding and communication.
Teams at systems visualize how tasks move between departments.
Everyone sees their role and how it fits into the bigger picture.
Collaboration increases because people understand each other's responsibilities.
Problem-solving becomes easier when everyone shares the same information.
Clients report that mapping processes leads to fewer misunderstandings and smoother handoffs. Teams communicate more clearly and solve problems faster.
Tip: Clear process maps help new team members learn their roles quickly and reduce confusion.
Informed Decisions
Teams and systems use process maps to make better decisions. Visual diagrams show where inefficiencies and resource gaps exist. Leaders use this information to guide changes and improvements.
Teams identify bottlenecks and fix them before they cause problems.
Systems rely on facts from process maps instead of guesses.
Strategic actions become more effective because decisions use real data.
Mapping financial procedures helps teams spot slow steps and errors. Faster processing and accurate reporting follow. Improved compliance supports better business strategies. Clients at systems and teams find that process mapping leads to smarter, data-driven choices.
Note: Process maps give leaders the information they need to plan and act with confidence.
Common Mistakes
Business process mapping offers many benefits, but organizations often fall into common traps that reduce its effectiveness. Recognizing these mistakes helps teams avoid wasted effort and achieve better results.
Overcomplicating Maps
Teams sometimes add too much detail to their process maps. This mistake can make diagrams confusing and hard to use. Overcomplicated maps often include every minor step, which distracts from the main workflow. Instead, teams should focus on key activities and use simple symbols. High-level visualizations work best at the start. Complexity should only increase when necessary.
Tip: Tailor the format to the audience. Executives need a big-picture view, while analysts may require more detail.
Regular reviews help teams remove unnecessary steps and streamline the process. Each step should add value to the overall result. Removing redundancies improves efficiency and saves time. Using auto-generated visual tools based on user behavior can also simplify process flows.
Mistake | Explanation |
|---|---|
Using different symbols and notations causes confusion. Standardization helps. | |
Using Ineffective Tools | Complex or cheap tools can block adoption and hinder efficiency. |
Missing Stakeholder Input
Another frequent mistake involves leaving out key stakeholders during mapping. Teams that rely on memory or only involve a few people risk missing important details. When the right employees do not participate, the process map may not reflect reality. Siloed processes can create delays and confusion among teams.
Siloed processes create delays and confusion.
Using multiple versions of the same process leads to inconsistencies.
Teams should identify all groups affected by the process. Including employees from different departments ensures accurate representation. Open feedback sessions and collaborative mapping help capture the full picture. Lack of governance and ownership often results in neglected processes over time.
Note: Involving the right people from the start leads to better engagement and more accurate maps.
Not Updating
Many organizations treat process mapping as a one-time project. This approach leads to outdated documentation and missed opportunities for improvement. Business processes change as new technologies and priorities emerge. Regular updates keep maps relevant and useful.
Treat process maps as living documents that need regular updates.
Schedule quarterly reviews or updates after significant changes.
Use reviews to identify inefficiencies and opportunities for improvement.
Storing processes in scattered tools or failing to assign ownership complicates management. Dedicated resources for ongoing maintenance ensure that process maps stay current. Regular reviews help teams spot inefficiencies and adapt to changes quickly.
Callout: Regularly updated process maps support continuous improvement and help organizations stay competitive.
By avoiding these common mistakes, teams can unlock the full value of business process mapping and drive lasting improvements.
Success Tips
Regular Reviews
Teams achieve better results when they review process maps on a regular basis. Scheduled reviews help teams spot outdated steps and identify new opportunities for improvement. Many organizations set quarterly or annual review dates. This routine keeps documentation accurate and relevant.
Teams should assign responsibility for maintaining process maps.
Leaders can use checklists to guide review sessions.
Stakeholders provide feedback during each review.
Tip: Regular reviews prevent errors and support continuous improvement. Teams that update their maps often adapt faster to changes in business needs.
A simple review checklist might include:
Review Item | Action Required |
|---|---|
Outdated steps | Remove or update |
New technologies | Integrate into workflow |
Stakeholder changes | Adjust responsibilities |
Compliance updates | Revise documentation |
Team Training
Training helps teams understand process mapping tools and techniques. Well-trained employees create accurate maps and spot inefficiencies quickly. Training sessions can include workshops, online courses, or hands-on practice.
Leaders should introduce new mapping tools with clear instructions.
Teams benefit from role-playing exercises that simulate real workflows.
Regular training builds confidence and encourages collaboration.
Note: Training reduces mistakes and increases engagement. Employees who understand process mapping contribute more ideas and support improvements.
A few training ideas:
Host interactive workshops with mapping exercises.
Provide video tutorials for new software.
Encourage peer-to-peer learning and sharing of best practices.
Use Technology
Technology makes process mapping easier and more effective. Digital tools allow teams to create, edit, and share maps quickly. Many platforms offer automation features that save time and reduce errors.
Teams can use cloud-based software for real-time collaboration.
Automation tools streamline repetitive tasks and highlight bottlenecks.
Integration with other business systems keeps data up to date.
Callout: Technology supports remote teams and enables faster decision-making. Digital maps are easier to update and distribute than paper diagrams.
A comparison of technology benefits:
Feature | Benefit |
|---|---|
Cloud collaboration | Teams work together remotely |
Automation | Reduces manual effort |
Integration | Keeps information current |
Analytics | Tracks performance metrics |
Teams that embrace technology improve efficiency and communication. They respond to changes quickly and maintain accurate process documentation.
Business Process Mapping uses three clear steps: choose a process, visualize it, and analyze for improvement. Teams gain efficiency and better communication by following this method. Anyone can start mapping today and see real progress. Regular reviews and learning help teams keep improving. For those who want more guidance or support, they can reach out for further information.
FAQ
What is business process mapping?
Business process mapping creates a visual diagram of how tasks flow in a process. It shows each step, who is responsible, and how work moves from start to finish. Teams use these maps to understand and improve their workflows.
Why should organizations use process mapping?
Process mapping helps teams find inefficiencies, reduce errors, and improve communication. It gives everyone a clear view of how work happens. Leaders use these maps to make better decisions and support continuous improvement.
Which tools work best for process mapping?
Teams often use digital tools like Lucidchart, Microsoft Visio, or Creately. These platforms offer templates, collaboration features, and easy editing. Paper and whiteboards help with quick sketches or brainstorming.
How often should teams update process maps?
Teams should review and update process maps at least once a year or after major changes. Regular updates keep maps accurate and useful. Scheduled reviews help teams spot outdated steps and new opportunities for improvement.
Who should participate in process mapping?
Key stakeholders include process owners, team members, and managers. Involving people from different departments ensures the map reflects real workflows. Broad participation leads to more accurate and effective process maps.
Can process mapping help with automation?
Yes. Process mapping identifies repetitive tasks and bottlenecks. Teams use these insights to automate steps, saving time and reducing errors. Automation works best when teams understand the full process.
What are common mistakes in process mapping?
Teams sometimes add too much detail, miss stakeholder input, or forget to update maps. These mistakes make maps less useful. Focusing on key steps and involving the right people helps avoid these problems.
How does process mapping support training?
Process maps give new team members a clear guide to follow. Visual diagrams help employees learn their roles faster. Training sessions often use process maps to explain tasks and responsibilities.


